Healthy eating policies
Background and key statistics
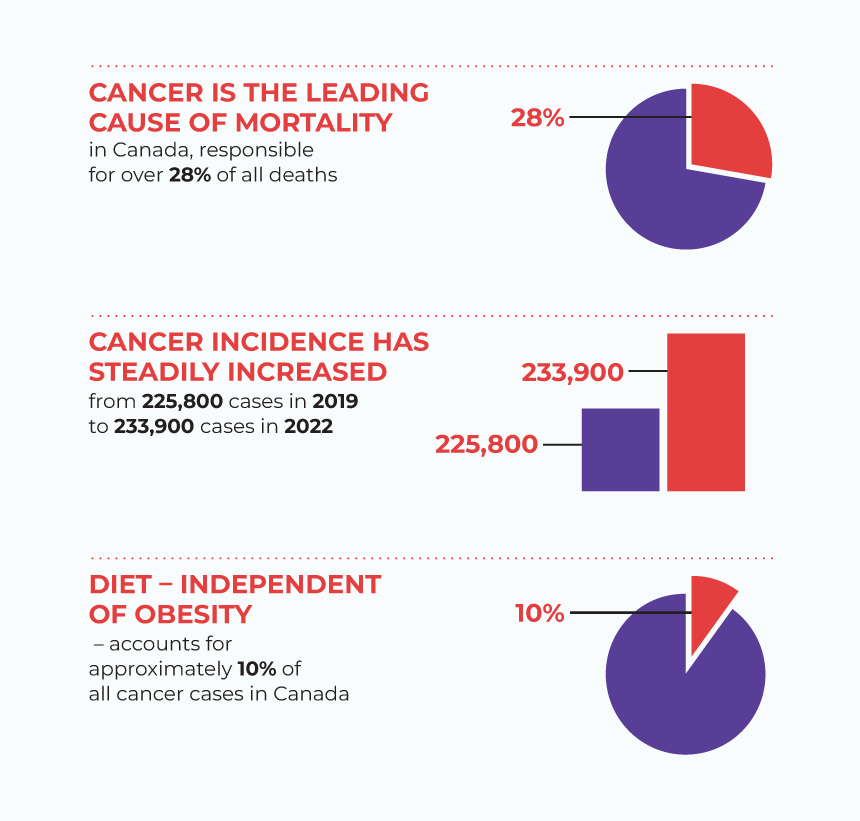
- Cancer causes considerable economic and public health pressures on the healthcare system, while impacting individual, social, financial, quality of life measures, and psychosocial factors.
- Healthy diets consisting of adequate fruit and vegetable consumption reduce the risk of developing esophageal, stomach, lung, pancreatic, and prostate cancer.1
- Unhealthy diets high in sugars, saturated and trans-fats, low-fibre foods, and high-sugar drinks increase the risk for endometrial, breast, and colorectal cancers.2
- An additional 1 serving of fruit per day is estimated to prevent 85,181 cancer cases in Canada.3
- Unhealthy eating, including excess red meat and processed meat consumption and inadequate fruit and vegetable intake, contributed to approximately 23,300 new cancer cases in Canada in 2022.4
Data sources: 5, 6 and 7
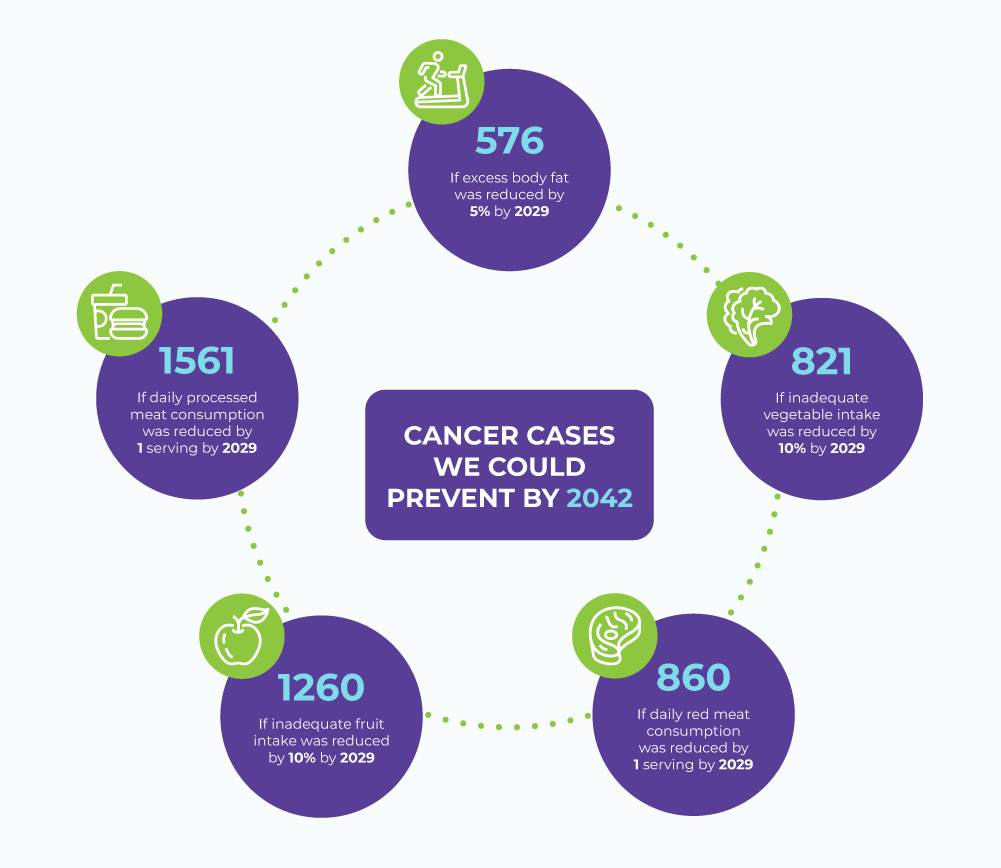
Cancer projections
If we can meet the following reductions by 2029, we can prevent the following number of cancer cases by 2042.8
Implementing healthy eating intervention policies will reduce cancer morbidity, mortality and improve health equity.
Healthy eating policies
- Food environment policies, such as food provision in schools, food labelling initiatives, food reformulation, and restrictive food retail policies, are effective in increasing healthy eating and decreasing unhealthy eating.
- Healthy eating policies involve legislation, regulations, guidelines, provincial and territorial policies, bylaws, and municipal plans.
- Policies that create supportive environments are more effective than individual or program approaches in improving population health given their reach, scalability, and sustainability.
- Different policy approaches may be needed across different settings and different population groups.
When designing policy, consider eight elements to effectively create change: relationships, staffing, expertise, resources, evidence, engagement, collaboration, and issue framing. Learn more on how to create a path to policy change.
Pathways to Policy represents critical success factors for policy development and implementation and can inform healthy eating policies across Canada.
Healthy eating policies – Provincial/territorial and municipal landscape
| Policy domain | Description | Emphasis given to policy domains at provincial/ territorial levels | Emphasis given to policy domains at a local level |
|---|---|---|---|
| Food prices | Food prices, as a policy action, refer to policies that lower the consumer cost of food and help make healthy eating choices easier, cheaper, and more accessible. | Medium | Medium |
| Food provision | Food provision, as a policy action, refers to healthy food service policies implemented in government-funded and private settings to encourage healthy food choices. | High | High |
| Food retail | Food retail, as a policy action, refers to government intervention to support the availability of healthy foods and to limit the availability of unhealthy foods in communities (outlet density and locations) and in-store (product placement). | Low | Medium |
| Food promotion | Food promotion, as a policy action, refers to the promotion and advertising of unhealthy foods across all media. | Medium | Low |
| Food composition | Food composition, as a policy action, refers to government systems that encourage processed foods and out-of-home meals to be nutrient-rich and of a healthy composition (e.g. limited sodium, saturated fat, trans fat, added sugar). | Low | Low |
| Food labelling | Food labelling, as a policy action, refers to government regulatory systems that direct labelling on food packaging and menu boards to prevent misleading claims and to enable consumers to make informed food choices. | Low | Low |
Two analysts independently reviewed Canadian healthy eating policies to provide a “label of emphasis” to help illustrate the current policy landscape. These labels are:
- LOW = no or very few provincial/territorial and municipal jurisdictions have adopted evidence-informed policy action, and/or the breadth of the policy action is limited in scope
- MEDIUM = some, but not all provincial/territorial and municipal jurisdictions have adopted evidence-informed policy action, and/or the breadth of the policy action is incomplete
- HIGH = most provincial/territorial and municipal jurisdictions have adopted comprehensive evidence-informed policy action
Percentage of population 12+ consuming five or more servings of fruits or vegetables daily, by jurisdiction, 2021
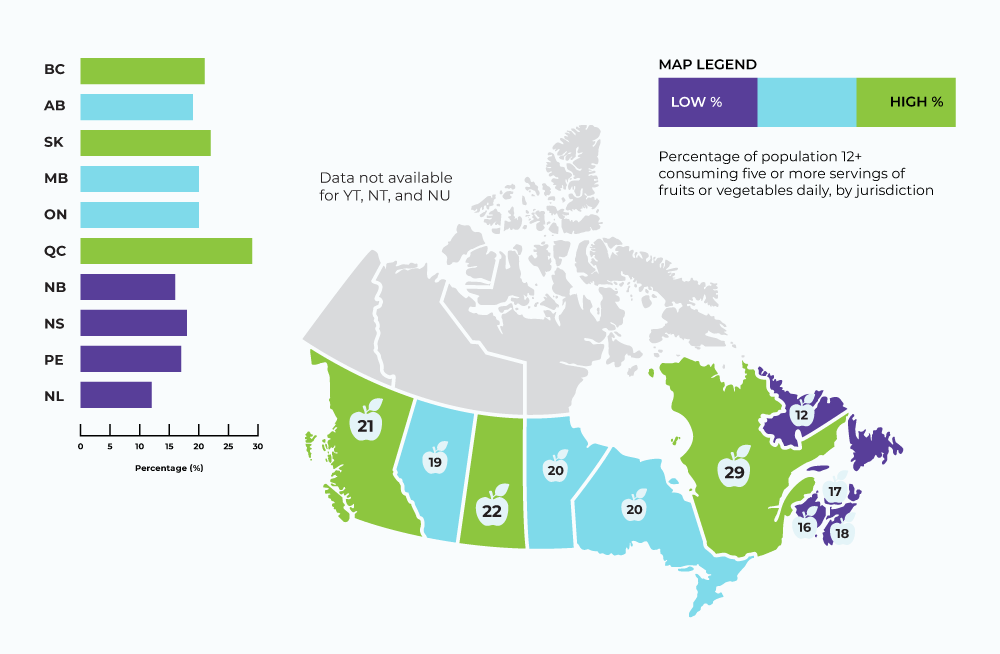
The percentage of people aged 12+ consuming five or more servings of fruits or vegetables daily ranges between a low of 12% in Newfoundland and Labrador and a high of 29% in Quebec. An interesting trend is that the Atlantic provinces report lower intake of fruits and vegetables with an average of 16%, compared to western provinces with an average of 21%.
Notes:
1. Fruit and vegetable consumption based on the total number of times per day the respondent (12+) eats fruits and vegetables.
2. The COVID-19 pandemic had a major impact on the data collection operations and response rates for this survey, especially for regions with few respondents. Therefore, data for the territories was not included in the figure above.
Data source: Canadian Community Health Survey, 2021
Percentage of population 12+ consuming five or more servings of fruits or vegetables daily, by income quintile, 2021
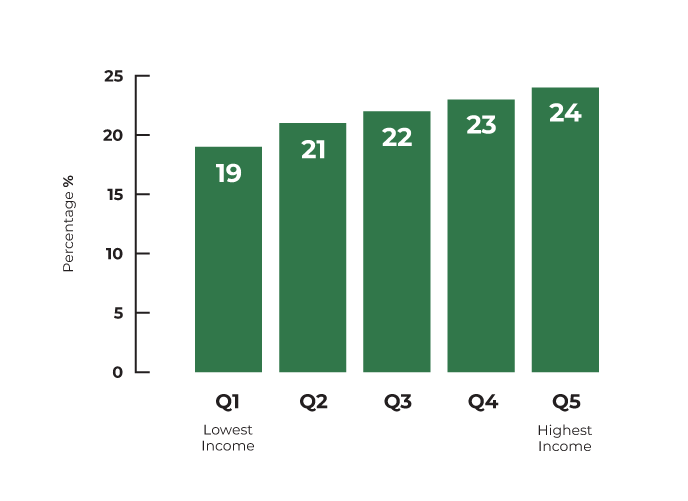 The percentage of people aged 12+ consuming five or more servings of fruits and vegetables daily increases as income increases. 19% in the lowest income quintile report consumption of five or more daily servings of fruits and vegetables compared to 24% in the highest income quintile.
Data source: Canadian Community Health Survey, 2021
Jurisdictional information on the consumption of fruits and vegetables, food insecurity, and body weight, 2021
The percentage of people living in Canada 12 years and older experiencing food insecurity ranges from a low of 7% in Quebec to a high of 12% in Nova Scotia and Saskatchewan. Further, the percentage of people living in Canada who are overweight or obese ranges from 59% in BC to 78% in Newfoundland and Labrador for those over 18 years of age, and from 20% in BC and Quebec to 40% in Newfoundland and Labrador and Saskatchewan for those under 18 years of age.
| Province or territory | Percentage of population aged 12+ experiencing food insecurity | Percentage of population aged 18+ classified as overweight or obese | Percentage of population aged <18 classified as overweight or obese |
|---|---|---|---|
| BC | 9% | 59% | 20% |
| AB | 10% | 65% | 34% |
| SK | 12% | 70% | 40% |
| MB | 10% | 68% | 33% |
| ON | 9% | 65% | 30% |
| QC | 7% | 65% | 20% |
| NB | 11% | 73% | no data available |
| NS | 12% | 71% | 28% |
| PE | 10% | 73% | no data available |
| NL | 10% | 78% | 40% |
Data source: Canadian Community Health Survey, 2021
Health Canada’s healthy eating strategy includes Canada’s food guide, which recommends a diet consisting of vegetables, fruits, protein foods, and whole grains. It also encourages people in Canada to cook more often, use food labels, and limit highly processed foods.
- Cancer.Net. (2019). Food and Cancer Risk. https://www.cancer.net/navigating-cancer-care/prevention-and-healthy-living/food-and-cancer-risk
- Ibid.
- ComPARe. (2019). ComPARe study on preventable cancers in Canada: https://prevent.cancer.ca/
- Ibid.
- Statistics Canada. (2020, November 26). Table 1 Leading causes of death in Canada, 2019.
- Brenner, D.R., Poirier, A., Woods, R.R., Ellison, L.F., Billette, J.-M., Demers, A.A., … Holmes, E. (2022). Projected estimates of cancer in Canada in 2022. Canadian Medical Association Journal, 194(17), E601. https://doi.org/10.1503/cmaj.212097
- Obesity Canada. (2021). What Causes Obesity? https://obesitycanada.ca/understanding-obesity/
- Canadian Partnership Against Cancer. OncoSim (version 3.6.0.89). Cited August 2022.