Supplementary data: Ontario
This page provides data visualizations related to the priorities for Canada’s cancer system.
The data tables and technical appendix for all indicators are available upon request at info@partnershipagainstcancer.ca.
Priority 1 Action 1: Help people to stop smoking or not start in the first place and live healthier lives
Topic: Keeping people smoke-free
Title of image: Percentage of individuals (aged ≥ 12) in ON classified as daily or occasional smokers
Caveats/limitations:
- This indicator was reported using the Canadian Community Health Survey (CCHS) and is based on self-reported data.
- Individuals who did not respond to the required CCHS questions regarding smoking status were not included in the analysis.
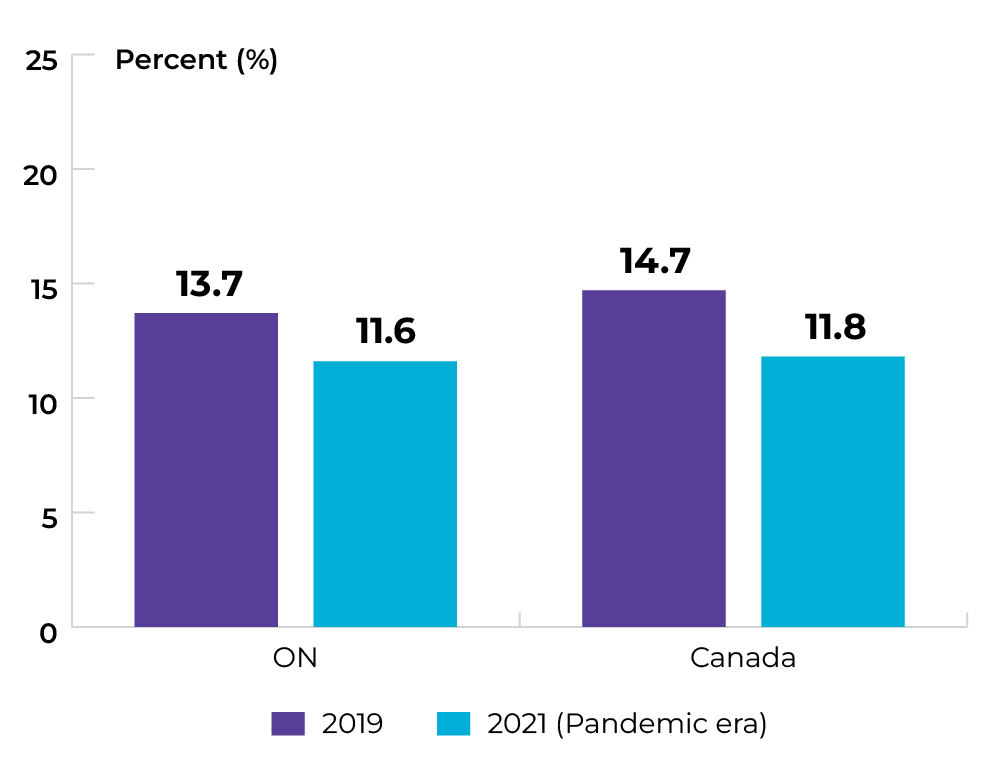
Data source: Canadian Community Health Survey
Topic: Keeping people smoke-free
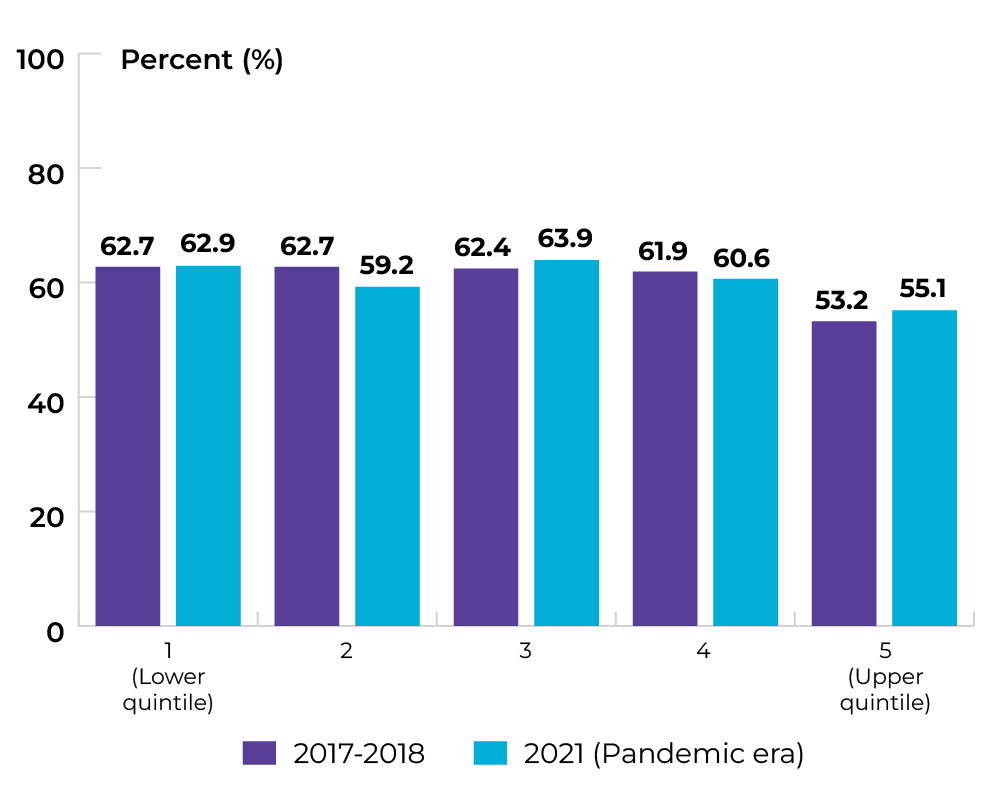
Title of image: Percentage of males in ON (aged ≥ 18) classified as daily or occasional smokers, by household income quintile
Caveats/limitations:
- This indicator was reported using the Canadian Community Health Survey (CCHS) and is based on self-reported data.
- Individuals who did not respond to the required CCHS questions regarding smoking status were not included in the analysis.
- Interpret with caution owing to large variability in the 2021 estimates.
- The COVID-19 pandemic had major impacts on the data collection operations and response rates for this survey.
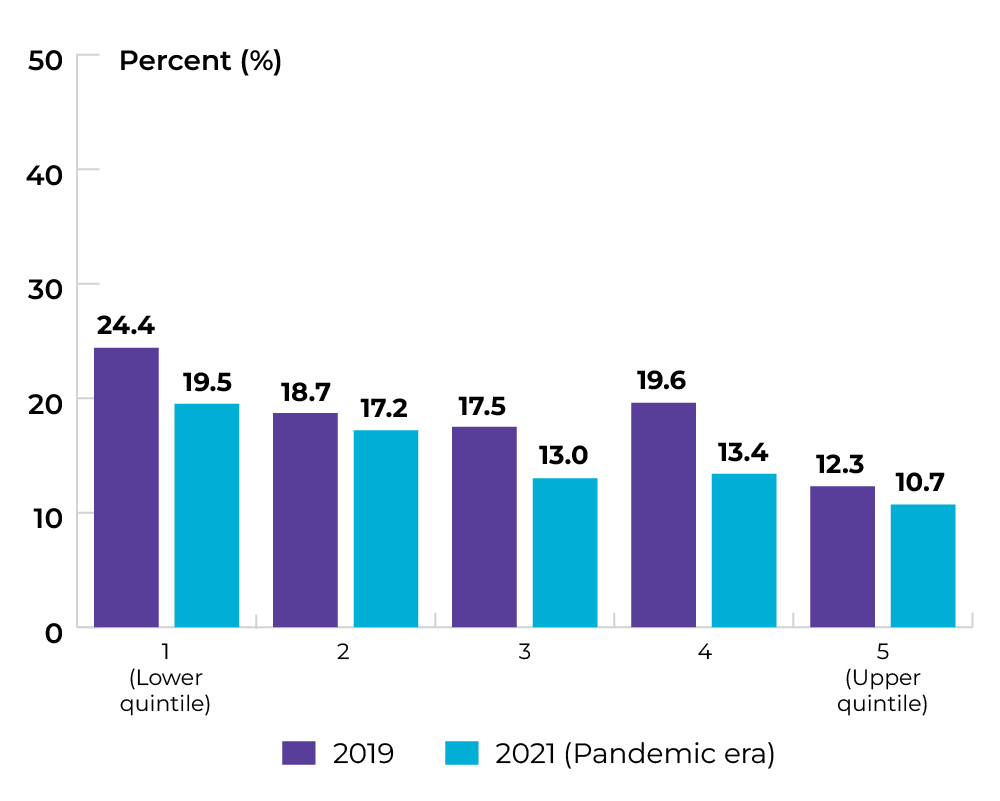
Data source: Canadian Community Health Survey
Topic: Keeping people smoke-free
Title of image: Percentage of females in ON (aged ≥ 18) classified as daily or occasional smokers, by household income quintile
Caveats/limitations:
- This indicator was reported using the Canadian Community Health Survey (CCHS) and is based on self-reported data.
- Individuals who did not respond to the required CCHS questions regarding smoking status were not included in the analysis.
- Interpret with caution owing to large variability in the 2021 estimates.
- The COVID-19 pandemic had major impacts on the data collection operations and response rates for this survey.
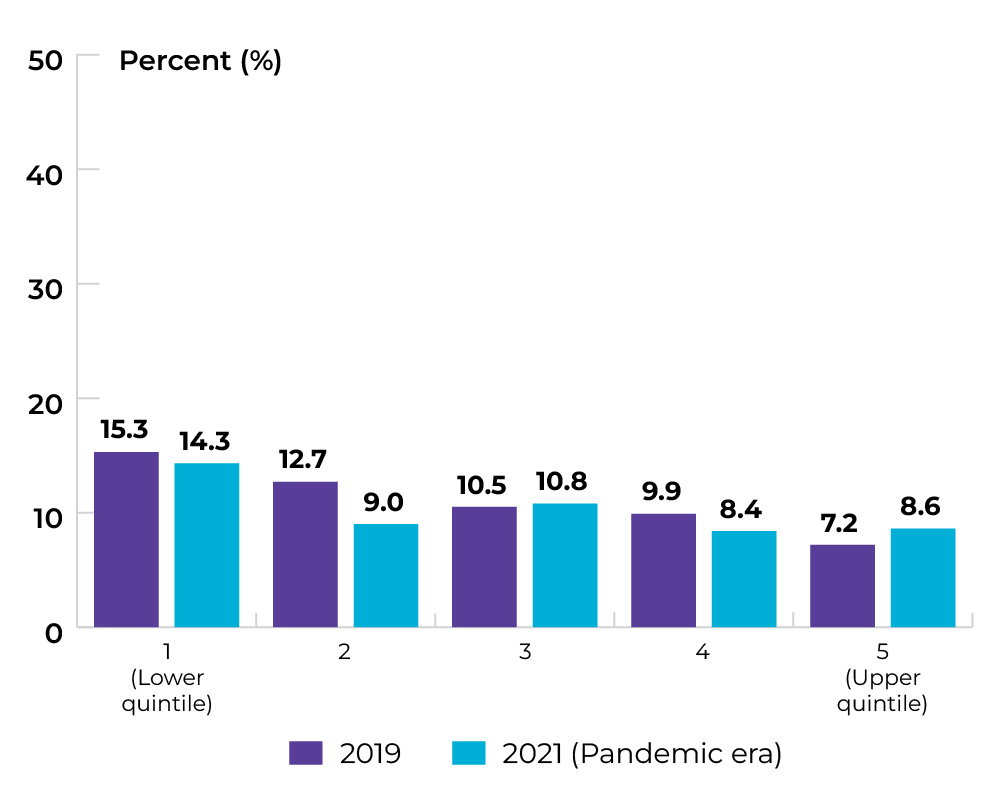 Data source: Canadian Community Health Survey
Topic: Keeping people smoke-free
Title of image: Percentage of males in ON (aged ≥ 18) classified as daily or occasional smokers, by highest level of education
Caveats/limitations: Interpret with caution owing to large variability in the 2021 estimates.
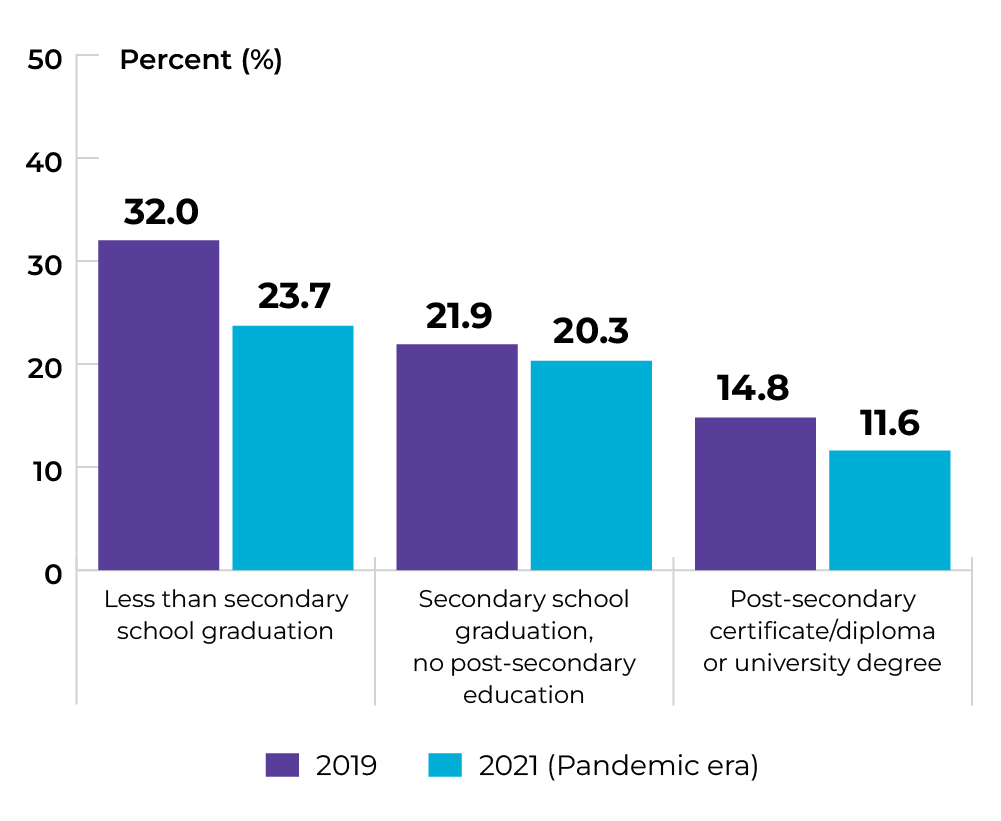
Data source: Canadian Community Health Survey
Topic: Keeping people smoke-free
Title of image: Percentage of females in ON (aged ≥ 18) classified as daily or occasional smokers, by highest level of education
Caveats/limitations: Interpret with caution owing to large variability in the 2021 estimates.
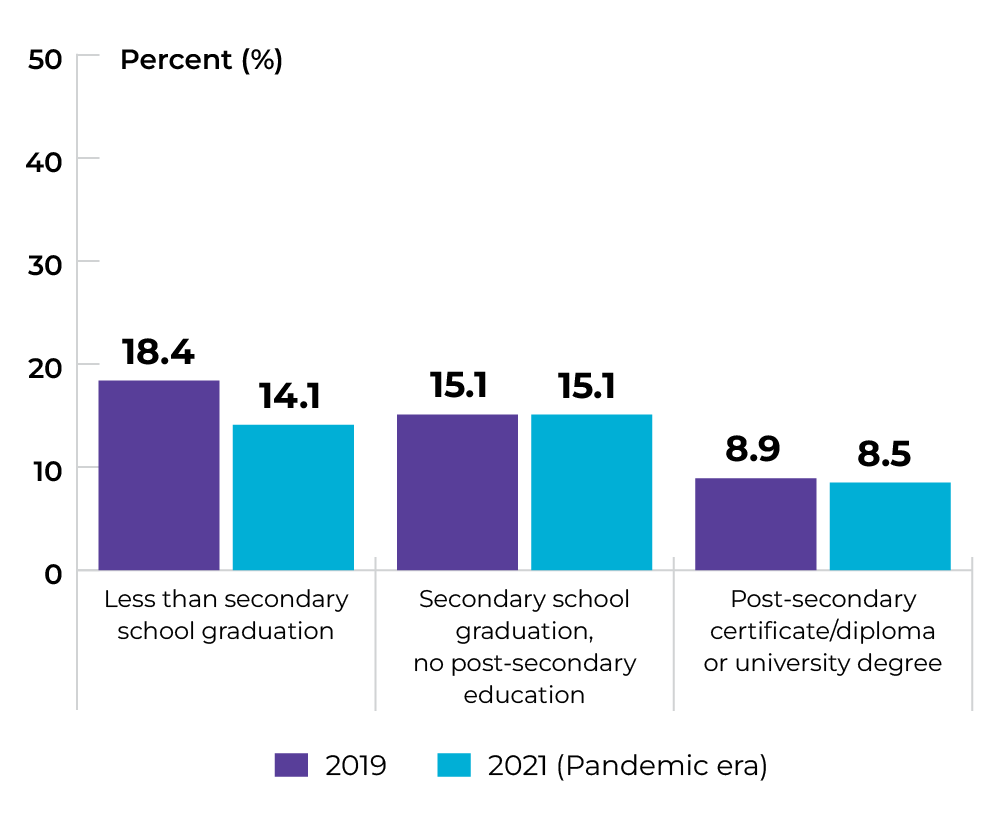 Data source: Canadian Community Health Survey
Topic: Maintaining healthy body weight
Title of image: Percentage of individuals in ON (aged ≥ 18) classified as overweight or obese
Caveats/limitations:
- This indicator was reported using the Canadian Community Health Survey (CCHS) and is based on self-reported data.
- Individuals who did not respond to the required CCHS questions to derive the BMI classifications were not included in the analysis.
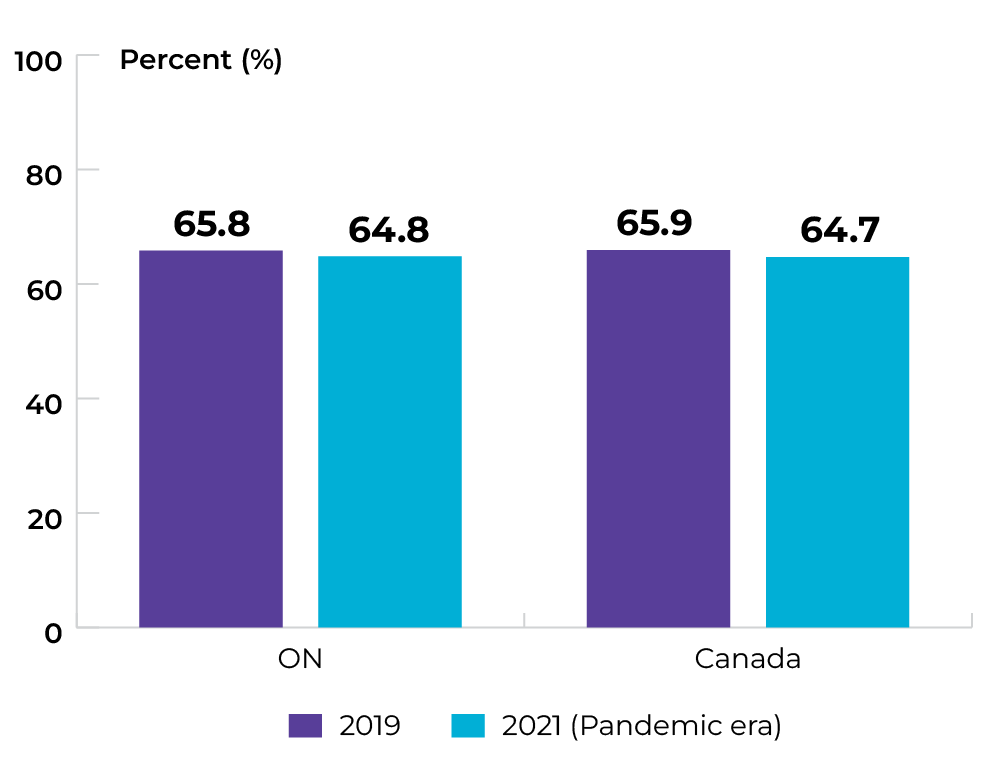
Data source: Canadian Community Health Survey
Topic: Maintaining healthy body weight
Title of image: Percentage of individuals in ON (aged ≥ 18) classified as overweight or obese, by sex
Caveats/limitations: The COVID-19 pandemic had major impacts on the data collection operations and response rates for this survey.
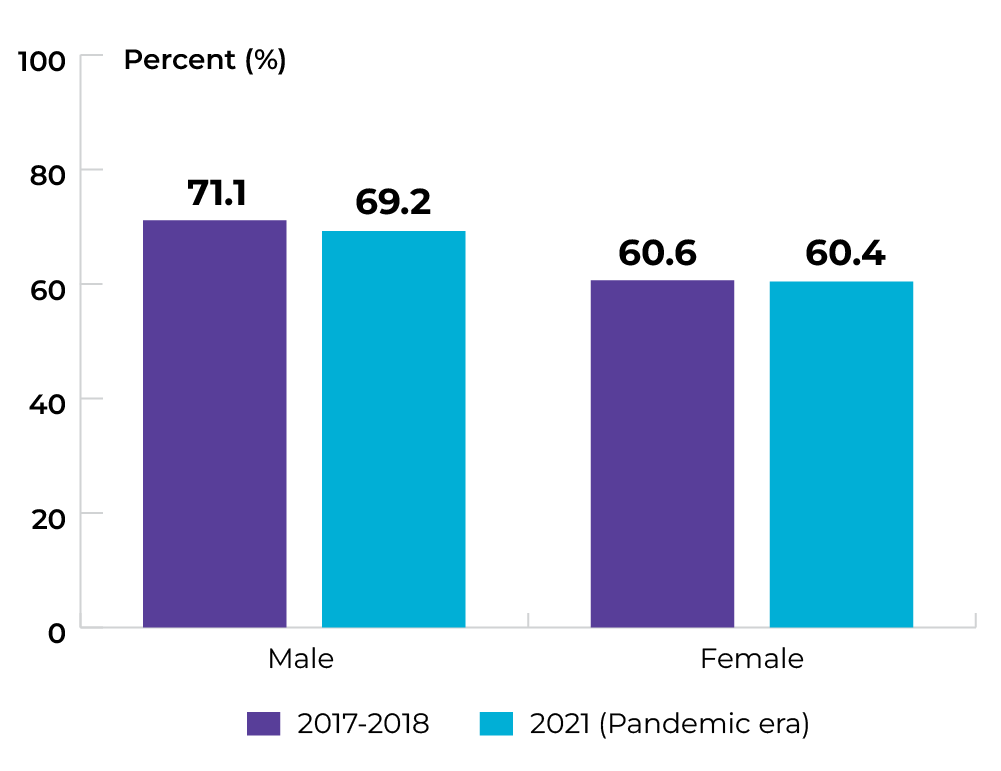
Data source: Canadian Community Health Survey
Topic: Maintaining healthy body weight
Title of image: Percentage of males in ON (aged ≥ 18) classified as overweight or obese, by income quintile
Caveats/limitations:
- Interpret with caution owing to large variability in the 2021 estimates.
- The COVID-19 pandemic had major impacts on the data collection operations and response rates for this survey.
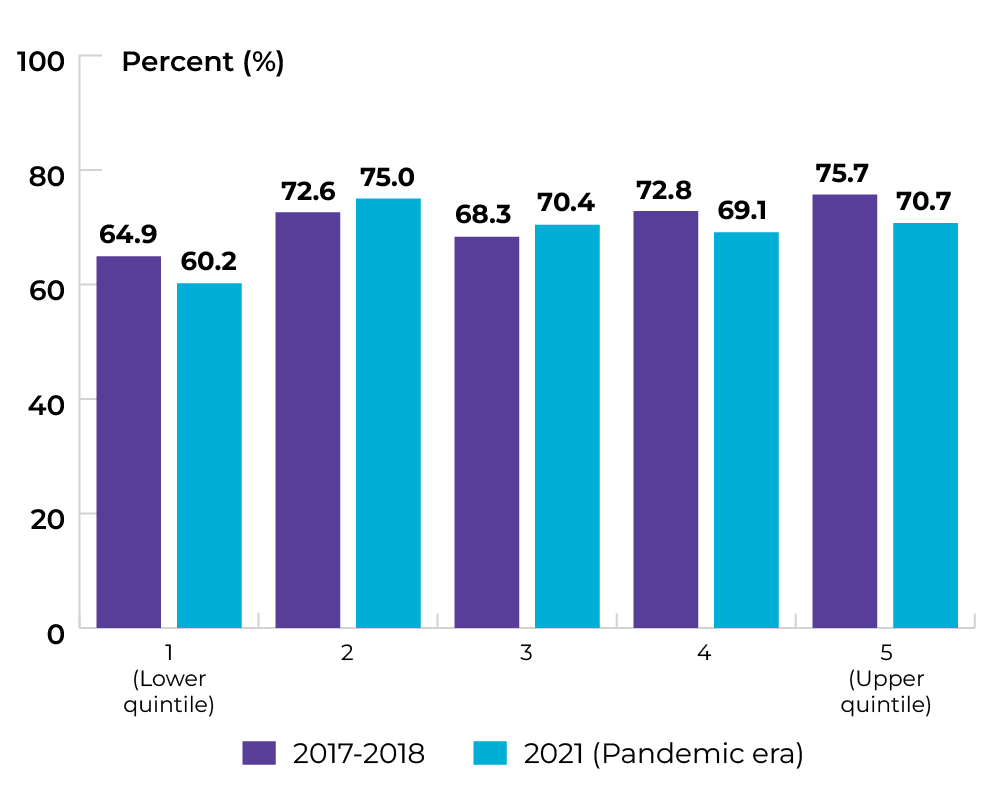
Data source: Canadian Community Health Survey
Topic: Maintaining healthy body weight
Title of image: Percentage of females in ON (aged ≥ 18) classified as overweight or obese, by income quintile
Caveats/limitations:
- Interpret with caution owing to large variability in the 2021 estimates.
- The COVID-19 pandemic had major impacts on the data collection operations and response rates for this survey.
 Data source: Canadian Community Health Survey
Priority 1 Action 2: Adopt proven practices known to reduce the risk of cancer
Topic: Increasing HPV vaccination
Title of image: Up-to-date human papillomavirus (HPV) immunization coverage among 12 year olds in Ontario, by school year
Caveats/limitations: The COVID-19 pandemic may have affected service provision.
Data source: Public Health Ontario
Topic: Increasing HPV vaccination
Title of image: Up-to-date human papillomavirus (HPV) immunization coverage among 17 year olds in Ontario, by school year
Caveats/limitations: The COVID-19 pandemic may have affected service provision.

Data source: Public Health Ontario
Topic: Increasing genetic testing
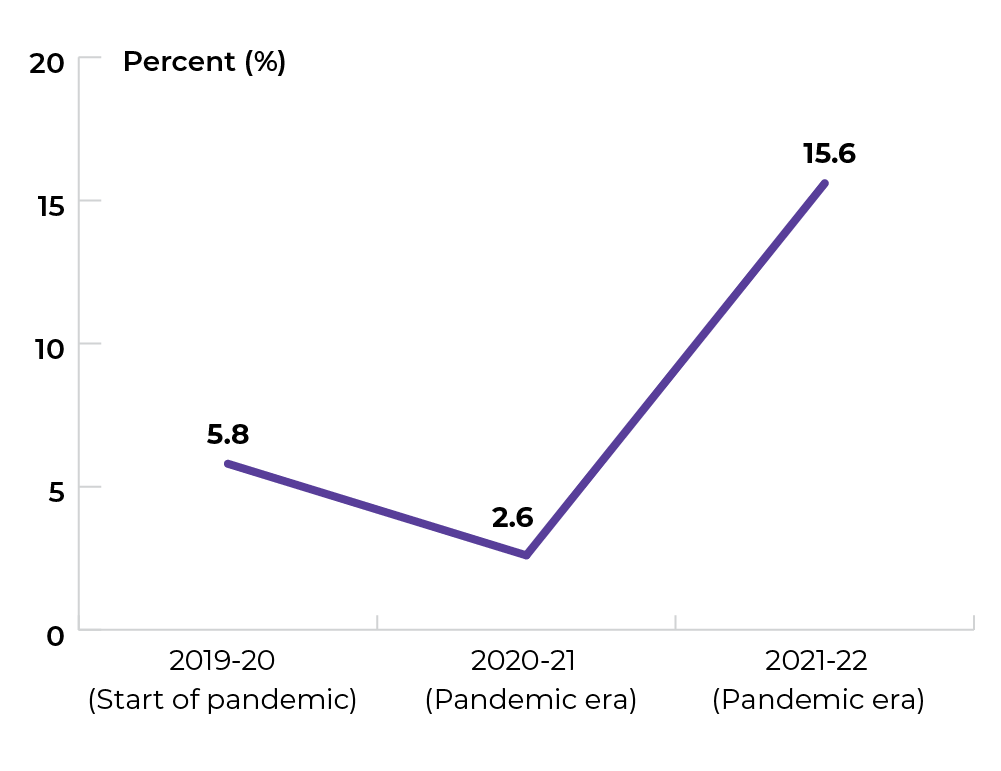
Title of image: Number of individuals aged 30 to 69 years in ON diagnosed with breast cancer, per 1,000 individuals who underwent genetic testing prior to cancer diagnosis, by age group
Caveats/limitations:
- This indicator only included genetic testing through the High Risk OBSP; genetic testing performed outside the program was not included.
- The COVID-19 pandemic may have affected service provision.

Title of table: Number of individuals aged 30 to 69 years in ON diagnosed with breast cancer, per 1,000 individuals who underwent genetic testing prior to cancer diagnosis, by age group
| Age group | 2018 | 2019 | 2020 (Start of pandemic) | 2021 (Pandemic era) |
|---|---|---|---|---|
| 30-39 | 16.1 | 20.1 | 25.4 | 10.6 |
| 40-49 | 21.0 | 11.4 | 19.3 | 23.5 |
| 50-59 | 16.4 | 18.6 | 19.8 | 21.9 |
| 60-69 | 13.6 | 10.1 | 13.7 | 18.7 |
Data source: Provincial cancer agencies and programs
Topic: Increasing genetic testing
Title of image: Number of individuals aged 30 to 69 years in ON diagnosed with breast cancer, per 1,000 individuals who underwent genetic testing prior to cancer diagnosis
Caveats/limitations:
- This indicator only included genetic testing through the High Risk OBSP; genetic testing performed outside the program was not included.
- The COVID-19 pandemic may have affected service provision.

Data source: Provincial cancer agencies and programs
Priority 2 Action 1: Prioritize rapid access to appropriate diagnosis for those suspected of having cancer
Topic: Reducing wait for diagnosis
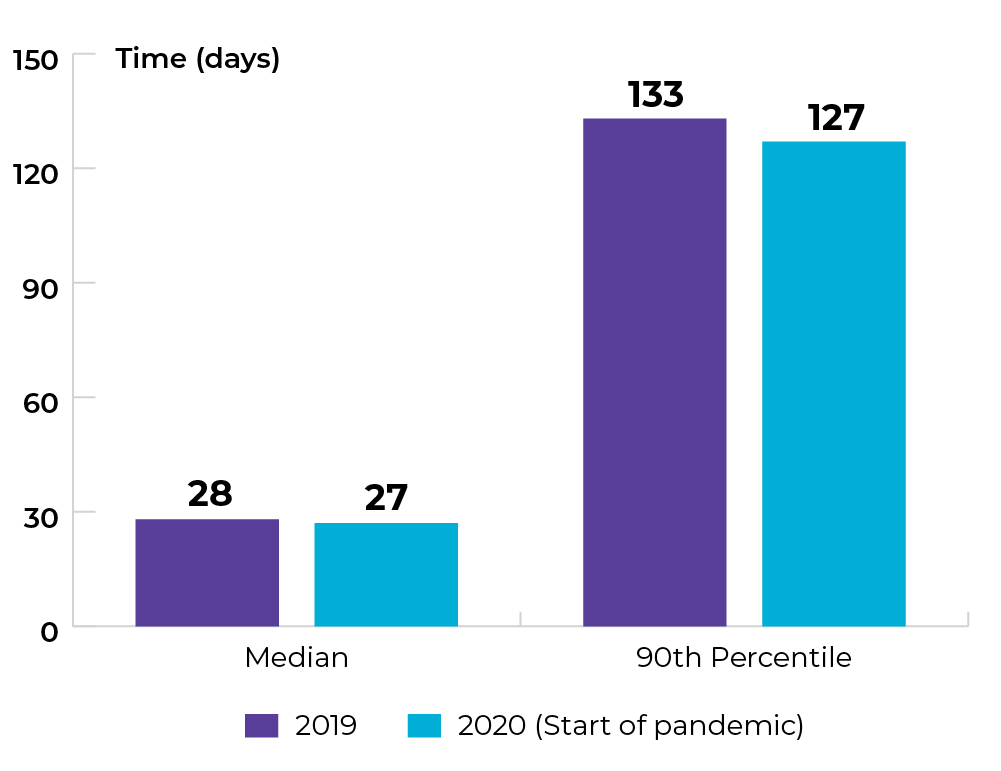
Title of image: Wait time (days) from suspicion of breast cancer to time of diagnosis
Caveats/limitations:
-
- This indicator includes all patients with breast cancer. For those with a prior breast cancer the algorithm may not be precise and may suggest longer wait times.
- The COVID-19 pandemic may have affected service provision.
 Data source: Provincial cancer agencies and programs
Topic: Diagnosing cancer earlier
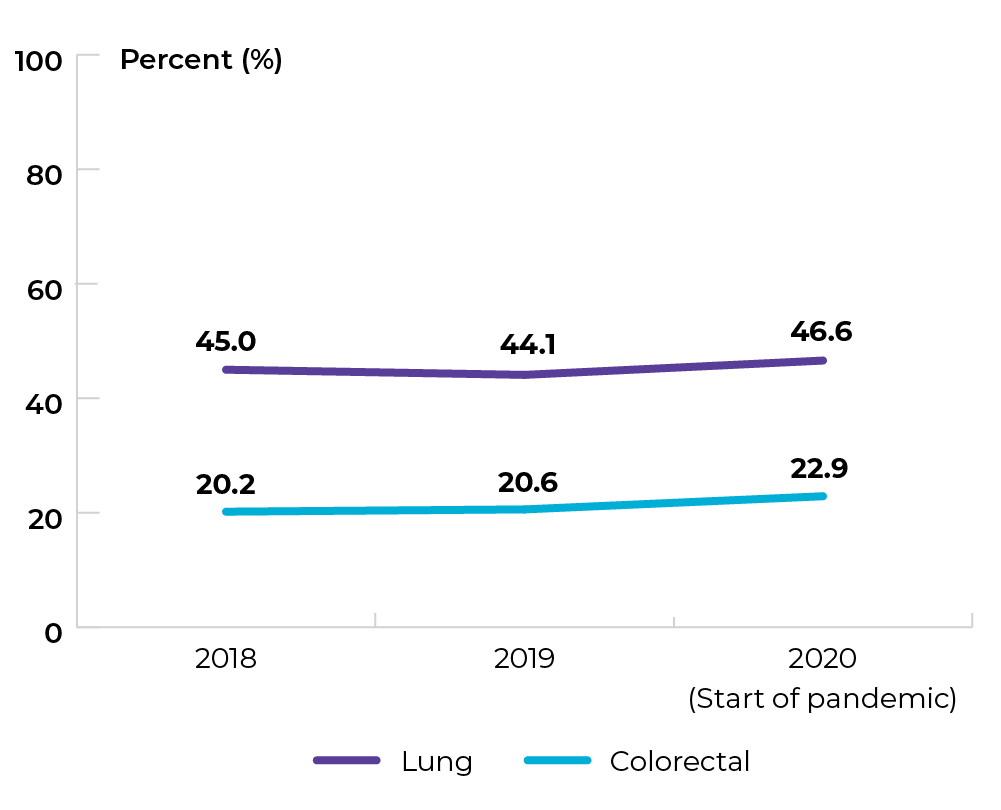
Title of image: Proportion of stage IV at diagnosis in ON for lung and colorectal cancers
Caveats/limitations: The COVID-19 pandemic may have affected service provision.
Data source: Provincial cancer agencies and programs
Topic: Diagnosing cancer earlier
Title of image: Proportion of stage at diagnosis in ON for lung cancer
Caveats/limitations:
- “Unknown stage” means that an attempt was made to stage the case, but the patient record was missing the necessary information. This could be because of limited stage work-up in the clinical setting.
- The COVID-19 pandemic may have affected service provision.

Title of table : Proportion of stage at diagnosis in ON for lung cancer
| Lung | 2018 | 2019 | 2020 (Start of pandemic) |
|---|---|---|---|
| Stage 1 | 26.5% | 27.5% | 26.3% |
| Stage 2 | 7.9% | 8.5% | 7.2% |
| Stage 3 | 18.8% | 18.0% | 17.7% |
| Stage 4 | 45.0% | 44.1% | 46.6% |
| Stade inconnu |
1.7% | 1.9% | 2.2% |
Data source: Provincial cancer agencies and programs
Topic: Diagnosing cancer earlier
Title of image: Proportion of stage at diagnosis in ON for colorectal cancer
Caveats/limitations:
- “Unknown stage” means that an attempt was made to stage the case, but the patient record was missing the necessary information. This could be because of limited stage work-up in the clinical setting.
- The COVID-19 pandemic may have affected service provision.
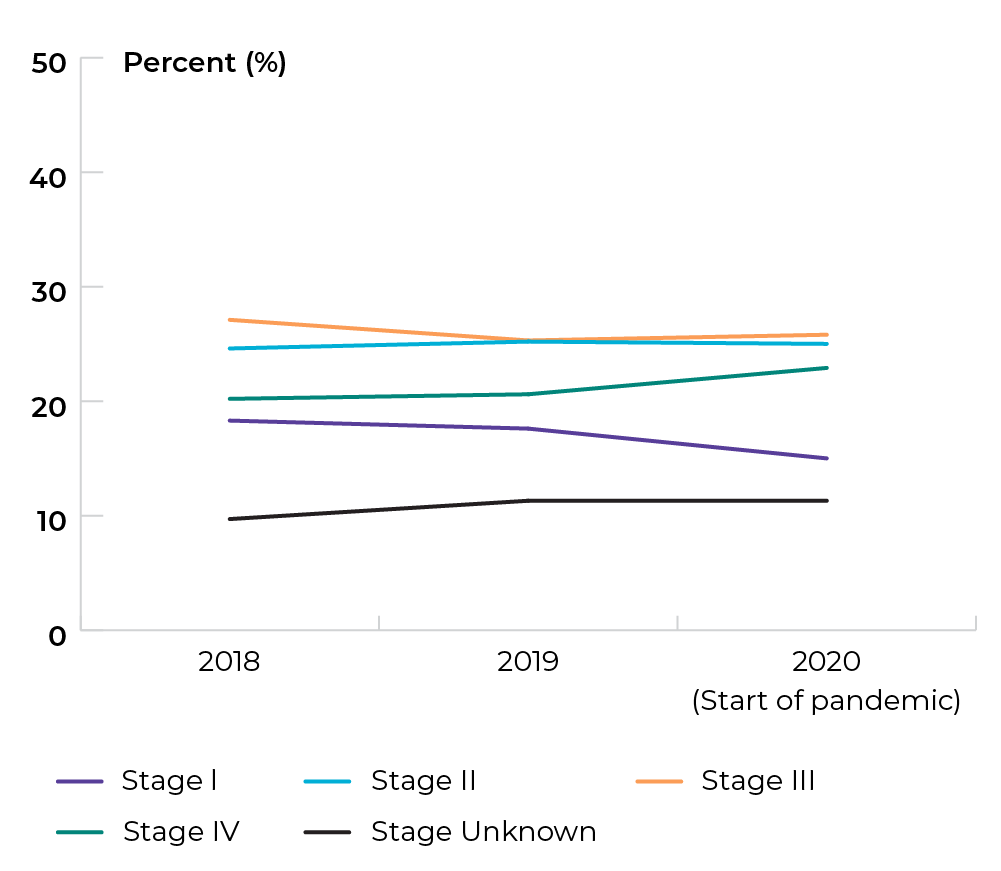
Title of table: Proportion of stage at diagnosis in ON for colorectal cancer
| Colorectal | 2018 | 2019 | 2020 (début de la pandémie) |
|---|---|---|---|
| Stage 1 | 18.3% | 17.6 % | 15.0 % |
| Stage 2 | 24.6% | 25.2 % | 25.0 % |
| Stage 3 | 27.1% | 25.3 % | 25.8 % |
| Stage 4 | 20.2 % | 20.6 % | 22.9 % |
| Stage unknown |
9.7 % | 11.3 % | 11.3 % |
Data source: Provincial cancer agencies and programs
Priority 2 Action 2: Prioritize rapid access to appropriate diagnosis for those suspected of having cancer
Topic: Increasing participation in colorectal cancer screening
Title of image: Percentage of screen-eligible people in ON who had at least one of the following: 1) FOBT/FIT test (in the last 2 years), 2) flexible sigmoidoscopy (in the last 10 years), or 3) colonoscopy (in the last 10 years)
Caveats/limitations: The COVID-19 pandemic may have affected service provision.

Data source: Provincial cancer agencies and programs
Topic: Increasing participation in colorectal cancer screening
Title of image: Percentage of screen-eligible people in ON who had at least one of the following: 1) FOBT/FIT test (in the last 2 years), 2) flexible sigmoidoscopy (in the last 10 years), or 3) colonoscopy (in the last 10 years), by age group
Caveats/limitations: The COVID-19 pandemic may have affected service provision.

Title of table: Percentage of screen-eligible people in ON who had at least one of the following: 1) FOBT/FIT test (in the last 2 years), 2) flexible sigmoidoscopy (in the last 10 years), or 3) colonoscopy (in the last 10 years), by age group
| Age group | 2017 | 2018 | 2019 | 2020 (start of pandemic) | 2021 (Pandemic era) |
|---|---|---|---|---|---|
| 50 – 54 | 51.7% | 51.5% | 50.9% | 46.5% | 47.2% |
| 55 – 59 | 60.8% | 60.9% | 60.5% | 56.5% | 57.2% |
| 60 – 64 | 65.8% | 65.3% | 65.0% | 60.5% | 61.6% |
| 65 – 69 | 70.0% | 69.3% | 69.1% | 64.3% | 65.4% |
| 70 – 74 | 70.0% | 69.7% | 69.7% | 65.4% | 66.6% |
Data source: Provincial cancer agencies and programs
Priority 3 Action 1: Set best practices and standards for care delivery and promote their adoption
Topic: Implementing multidisciplinary care for rectal cancer patients
Title of image: Percentage of GI Multidisciplinary Cancer Conferences (MCCs) that were standards concordant, by fiscal year
Caveats/limitations: The COVID-19 pandemic may have affected service provision.
 Data source: Provincial cancer agencies and programs
Topic: Implementing multidisciplinary care
Title of image: Estimated percentage of pediatric patients with cancer (all cancers combined) who were discussed by a multidisciplinary care team within 1 month of treatment initiation in the past year (2020-2021)
Caveats/limitations: These data are based on the estimated percentages of children with cancer discussed in multidisciplinary tumour boards, based on semi-structured interviews, conducted by POGO, with Tumour Board Leads at the pediatric cancer programs in Ontario.
Data source: Provincial cancer agencies and programs
Priority 3 Action 2: Eliminate low-benefit practices and adopt high-value practices
Topic: Optimizing care at end of life
Title of image: Percentage of cancer patients who received systemic therapy in the last two weeks of life
Caveats/limitations:
- Ontario Health reports systemic treatment within the last 30 days of life for Ontario-specific reporting.
- The COVID-19 pandemic may have affected service provision.

Data source: Provincial cancer agencies and program
Topic: Optimizing screening and appropriate follow-up
Title of image: Percentage of people with a cervix aged 18-24 who received a cytology (Pap) test
Caveats/limitations:
- The Ontario Cervical Screening Program does not recommend screening before age 21. Starting in June 2020, the program is encouraging healthcare providers to delay the initiation of cervical screening until age 25 for immune competent people. This is based on moderate quality evidence suggesting that people under age 25 do not benefit from cervical screening. The program will formally change the age of initiation for cervical screening from 21 to 25 for most people with the implementation of human papillomavirus testing in the program. Click here for more information.
- The COVID-19 pandemic may have affected service provision.

Data source: Provincial cancer agencies and programs
Priority 4 Action 2: Ensure rural and remote communities have the resources required to better serve their people
Topic: Increasing access to virtual care
Title of image: Percentage of cancer patients and visits from rural/remote communities using virtual health appointments
Caveats/limitations: The COVID-19 pandemic may have affected service provision.
 Data source: Provincial cancer agencies and programs
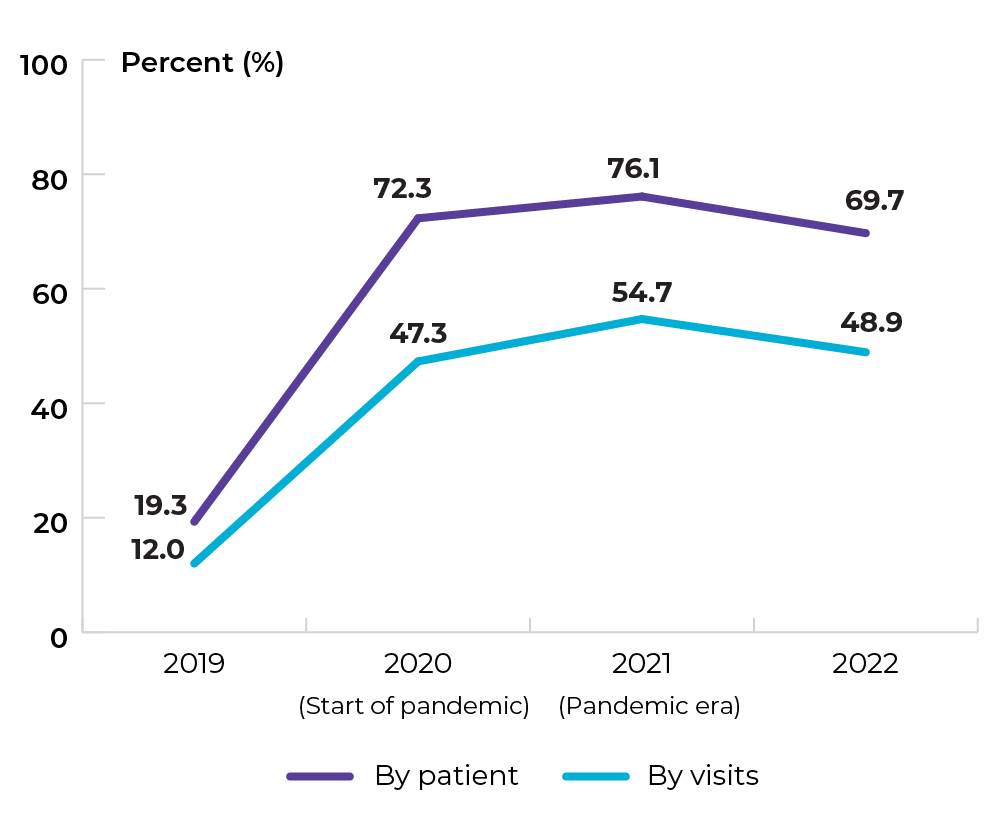
Topic: Increasing access to virtual care
Title of image: Percentage of appointments for cancer patients from rural/remote communities using virtual health, by appointment type
Caveats/limitations: The COVID-19 pandemic may have affected service provision.

| Appointment level | 2019 | 2020 (Start of pandemic) | 2021 (Pandemic era) | 2022 |
|---|---|---|---|---|
| Systemic | 10.9% | 42.6% | 49.0% | 42.9% |
| Radiation | 13.9% | 54.5% | 62.8% | 57.6% |
| Psychosocial oncology | 15.5% | 61.1% | 73.0% | 68.5% |
Data source: Provincial cancer agencies and programs
Topic: Increasing access to virtual care
Title of image: Percentage of cancer patients from rural/remote communities using virtual health, by appointment type
Caveats/limitations: The COVID-19 pandemic may have affected service provision.

Title of table:
| Patient level | 2019 | 2020 (Start of pandemic) | 2021 (Pandemic era) | 2022 |
|---|---|---|---|---|
| Systemic | 15.2% | 66.4% | 69.4% | 61.9% |
| Radiation | 17.2% | 69.1% | 75.3% | 69.8% |
| Psychosocial oncology | 28.6% | 72.4% | 85.5% | 82.2% |
Data source: Provincial cancer agencies and programs
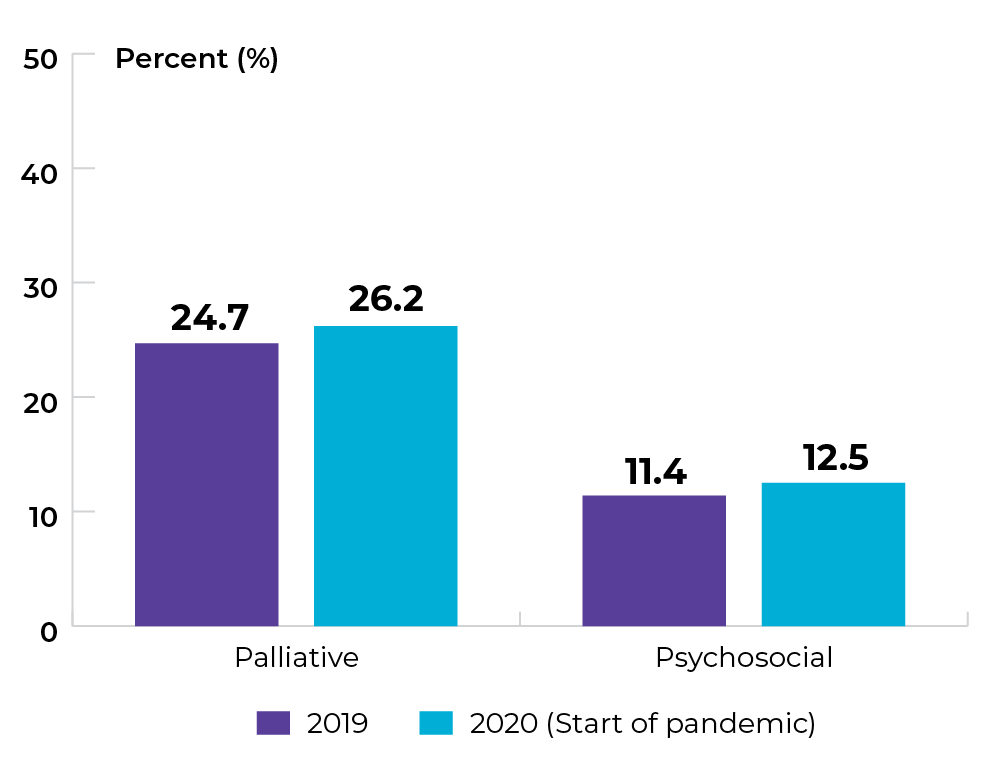
Topic: Increasing access to supportive care services
Title of image: Percentage of patients with cancer in rural/remote areas who received palliative care or psychosocial oncology services
Note: Palliative care and psychosocial service utilization in rural/remote areas was comparable to that of urban areas.
Caveats/limitations: The COVID-19 pandemic may have affected service provision.
Data source: Provincial cancer agencies and programs
Priority 4 Action 3: Ensure care can be delivered between provinces, territories and federal jurisdictions when needed
Topic: Improving access to timely care for people who need to travel between jurisdictions
Title of image: Number of patients who received funding approval under the Ontario Health Insurance Plan for cancer treatment outside of Canada, by fiscal year
Caveats/limitations: The COVID-19 pandemic may have affected service provision.
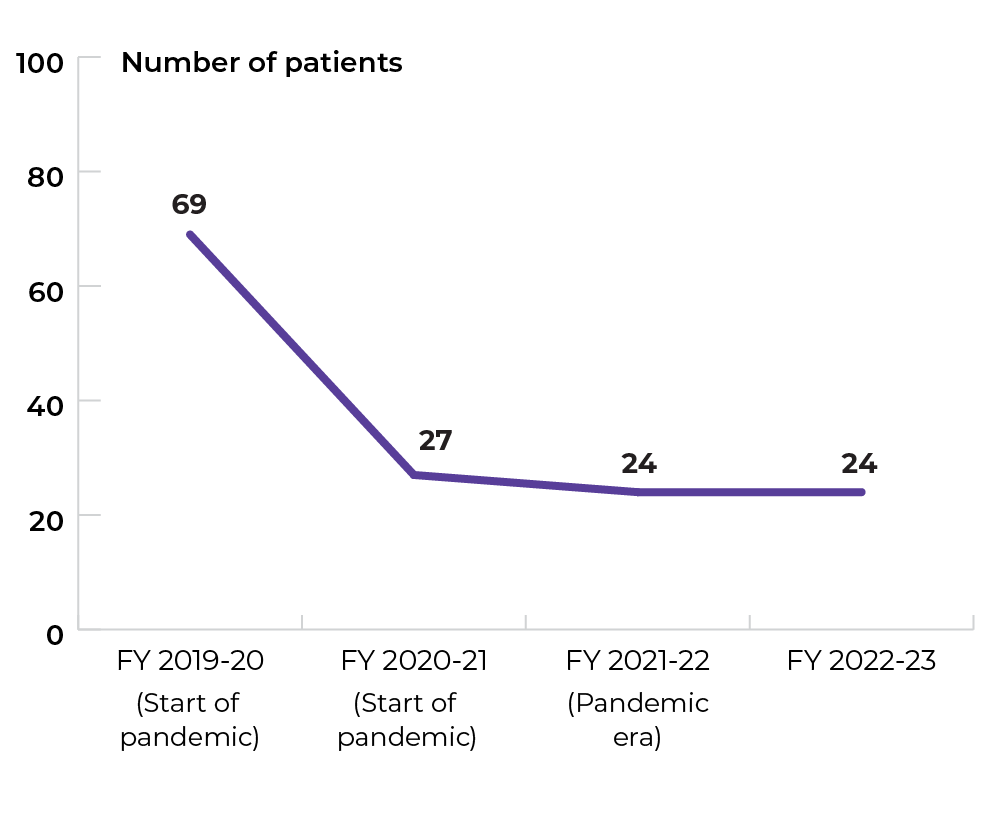
Data source: Provincial cancer agencies and program
Priority 5 Action 1: Integrate the full spectrum of information and support services to ensure people are fully supported throughout the cancer experience
Topic: Improving access to shared medical records
Title of image: Percentage of clinicians with access to clinical viewer with treatment data consolidated (including cancer) who are active users of the clinical viewer
Caveats/limitations:
- Data included patients with cancer but was not exclusively for this patient population.
- Data was sampled for authorized and active users on June 30th for 2023 data, and on September 30th for 2020 and 2021 data.
- The COVID-19 pandemic may have affected service provision.
Data source: Provincial cancer agencies and program
Priority 5 Action 3: Support children, adolescents and young adults at key transition points in their unique cancer journeys
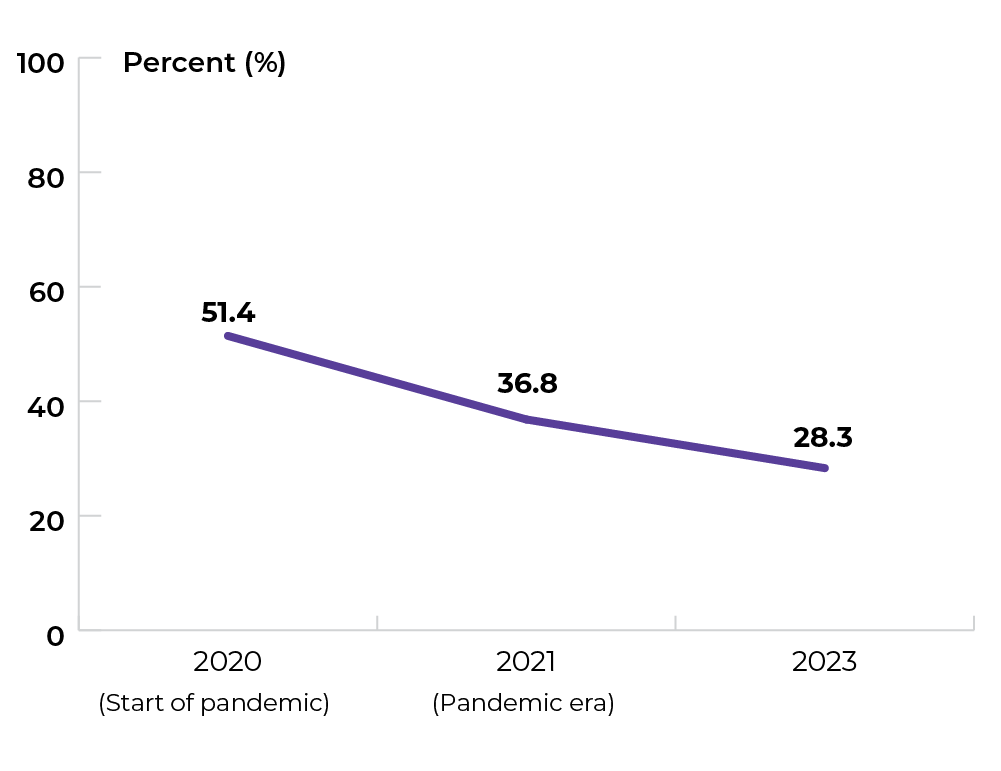
Topic: Improving care for adolescents and young adults with cancer
Title of image: Percentage of AYA with cancer who had a specialized care plan pathway, 2021
Caveats/limitations:
- Other gender and remote location categories are suppressed due to fewer than 5 responses.
- Please note that recruitment for this survey did not target specific groups within the YACC’s community (e.g., by gender, location), but went to the community at large, which has a higher percentage of people identifying as female and living in an urban area. This means the proportion of respondents with different characteristics may not be evenly distributed.
 Data source: Young Adult Cancer Canada (YACC) Survey 2021
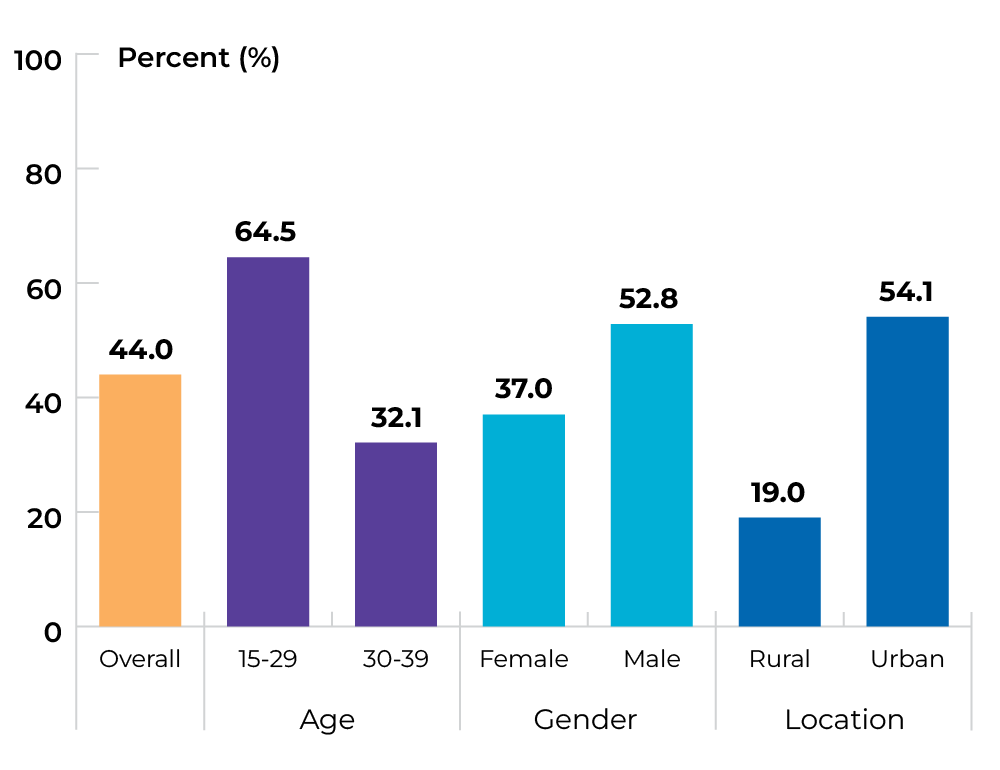
Topic: Improving care for adolescents and young adults with cancer
Title of image: Percentage of AYA with cancer who had a positive experience of transition in care along their cancer journey, 2021
Data source: Young Adult Cancer Canada (YACC) Survey 2021
The data tables and technical appendix for all indicators are available upon request at info@partnershipagainstcancer.ca. You will receive a response in two to three business days.