Supplementary data: Newfoundland and Labrador
This page provides data visualizations related to the priorities for Canada’s cancer system.
The data tables and technical appendix for all indicators are available upon request at info@partnershipagainstcancer.ca.
Priority 1 Action 1: Help people to stop smoking or not start in the first place and live healthier lives
Topic: Keeping people smoke-free
Title of image: Percentage of individuals in NL (aged ≥ 12) classified as daily or occasional smokers
Caveats/limitations:
- This indicator was reported using the Canadian Community Health Survey (CCHS).
- Individuals who did not respond to the required CCHS questions regarding smoking status were not included in the analysis.
- The COVID-19 pandemic had major impacts on the data collection operations and response rates for this survey.
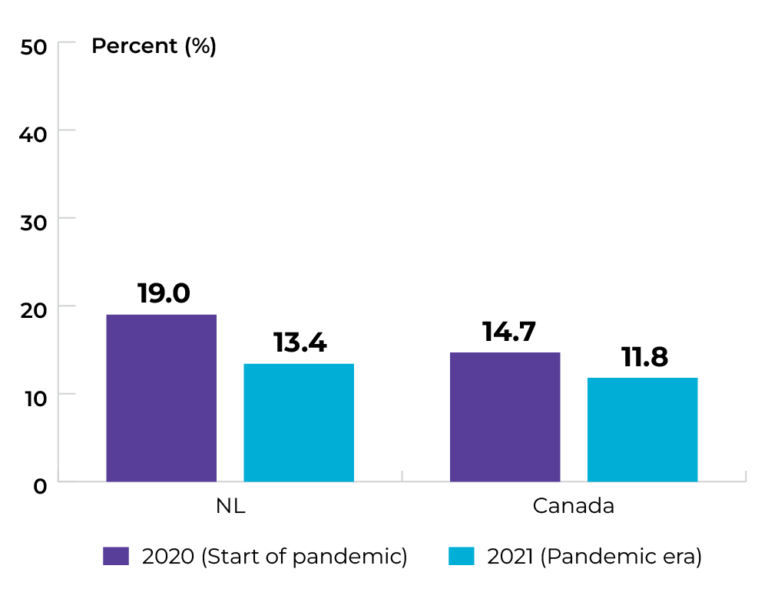
Data source: Canadian Community Health Survey
Topic: Keeping people smoke-free
Title of image: Percentage of males in NL (aged ≥ 18) classified as daily or occasional smokers, by household income quintile and sex
Caveats/limitations:
- The COVID-19 pandemic had major impacts on the data collection operations and response rates for this survey.
- Interpret with caution owing to large variability in the 2021 estimates.
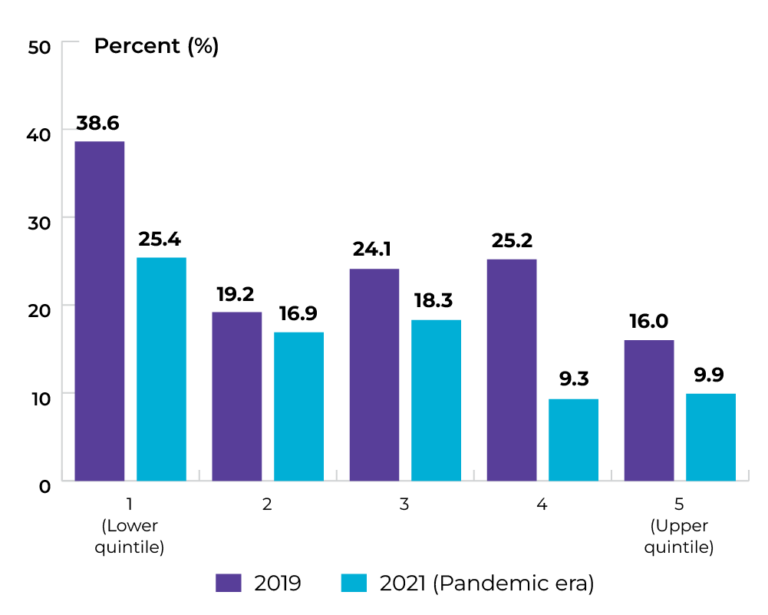
Data source: Canadian Community Health Survey
Topic: Keeping people smoke-free
Title of image: Percentage of females in NL (aged ≥ 18) classified as daily or occasional smokers, by household income quintile
Caveats/limitations:
- The COVID-19 pandemic had major impacts on the data collection operations and response rates for this survey.
- Interpret with caution owing to large variability in the 2021 estimates.
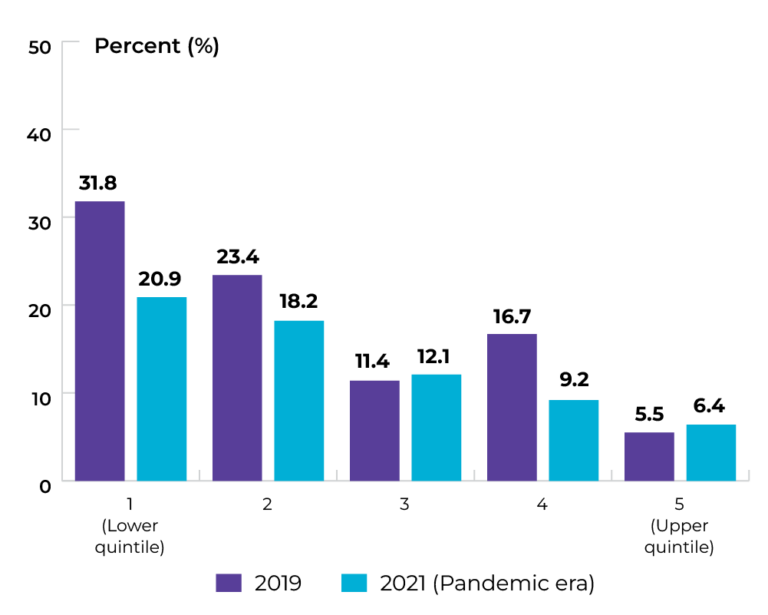
Data source: Canadian Community Health Survey
Topic: Keeping people smoke-free
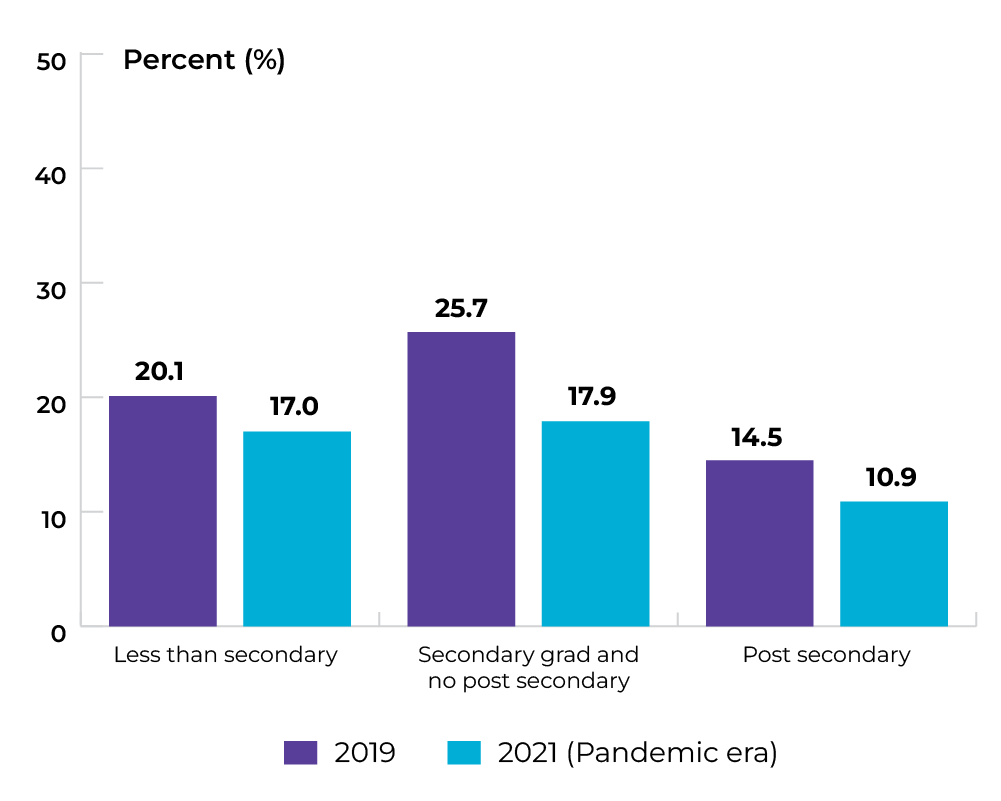
Title of image: Percentage of males in NL (aged ≥ 18) classified as daily or occasional smokers, by highest level of education
Caveats/limitations:
- The COVID-19 pandemic had major impacts on the data collection operations and response rates for this survey.
- Interpret with caution owing to large variability in the 2021 estimates.
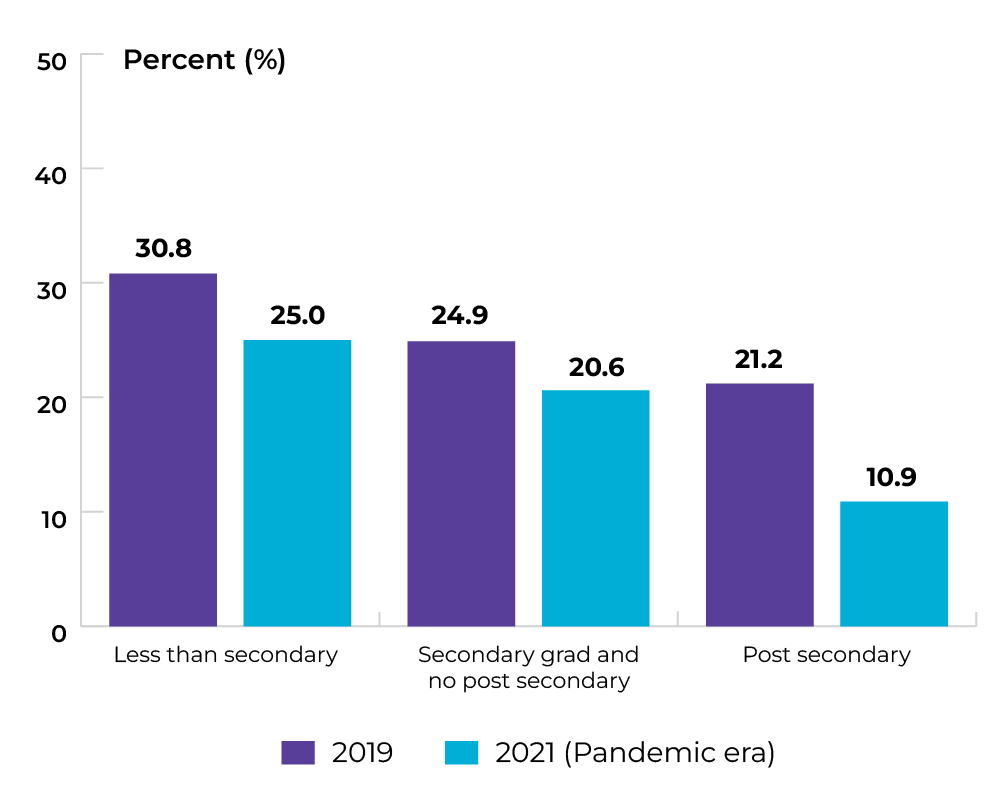
Data source: Canadian Community Health Survey
Topic: Keeping people smoke-free
Title of image: Percentage of males in NL (aged ≥ 18) classified as daily or occasional smokers, by highest level of education
Caveats/limitations:
- The COVID-19 pandemic had major impacts on the data collection operations and response rates for this survey.
- Interpret with caution owing to large variability in the 2021 estimates.
Data source: Canadian Community Health Survey
Topic: Maintaining healthy body weight
Title of image: Percentage of individuals in NL (aged ≥ 18) classified as overweight or obese
Caveats/limitations:
- This indicator was reported using the Canadian Community Health Survey (CCHS). Overall obesity and overweight percentages are reported using 2019 data. Percentages by income quintile and/or sex are reported using 2017-2018 data.
- Individuals who did not respond to the required CCHS questions to derive the BMI classifications were not included in the analysis.
- The COVID-19 pandemic had major impacts on the data collection operations and response rates for this survey.
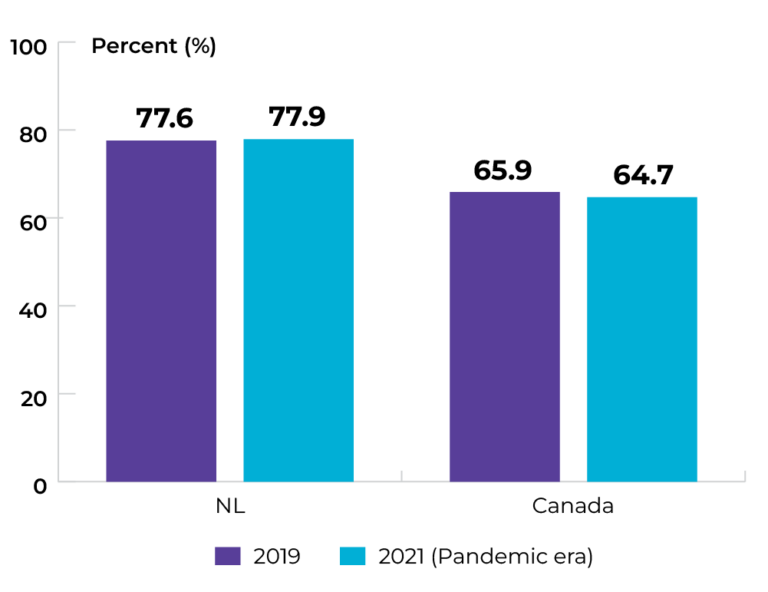
Data source: Canadian Community Health Survey
Topic: Maintaining healthy body weight
Title of image: Percentage of individuals in NL (aged ≥ 18) classified as overweight or obese, by sex
Caveats/limitations: The COVID-19 pandemic had major impacts on the data collection operations and response rates for this survey.
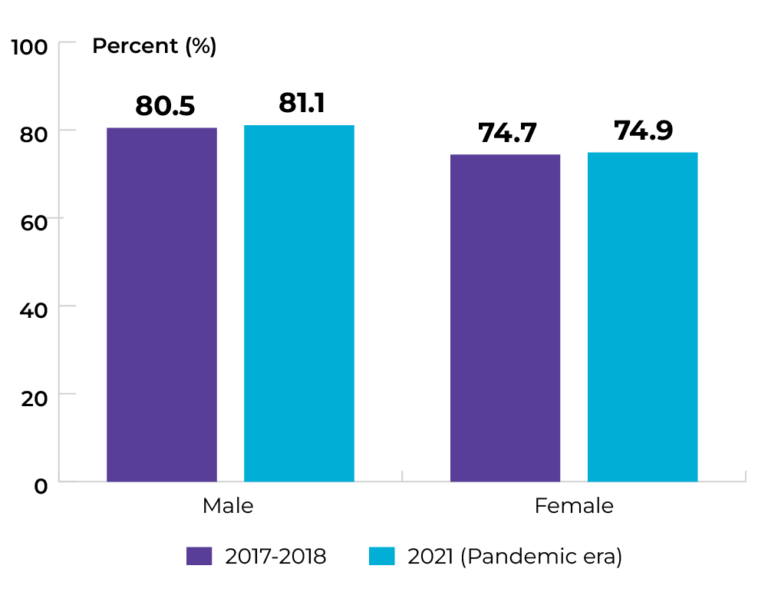
Data source: Canadian Community Health Survey
Topic: Maintaining healthy body weight
Title of image: Percentage of males in NL (aged ≥ 18) classified as overweight or obese, by income quintile
Caveats/limitations:
- The COVID-19 pandemic had major impacts on the data collection operations and response rates for this survey.
- Interpret with caution owing to large variability in the 2021 estimates.
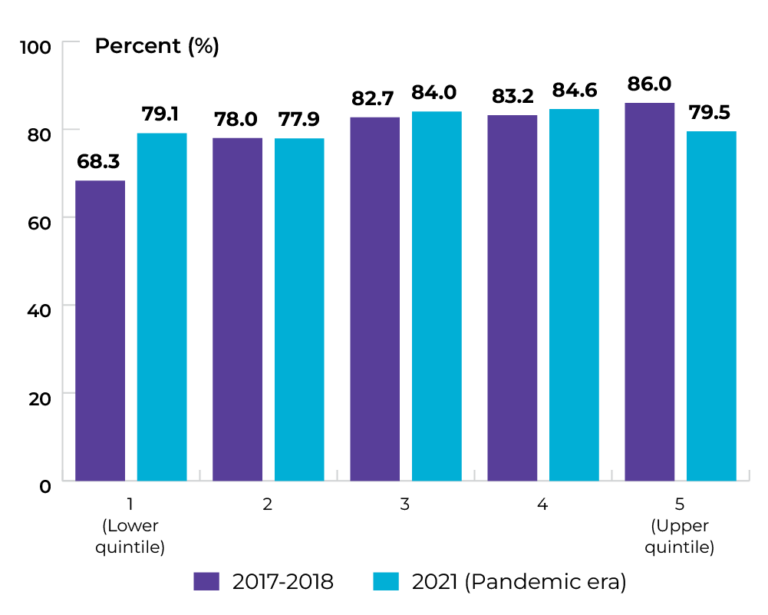
Data source: Canadian Community Health Survey
Topic: Maintaining healthy body weight
Title of image: Percentage of females in NL (aged ≥ 18) classified as overweight or obese, by income quintile
Caveats/limitations:
- The COVID-19 pandemic had major impacts on the data collection operations and response rates for this survey.
- Interpret with caution owing to large variability in the 2021 estimates.
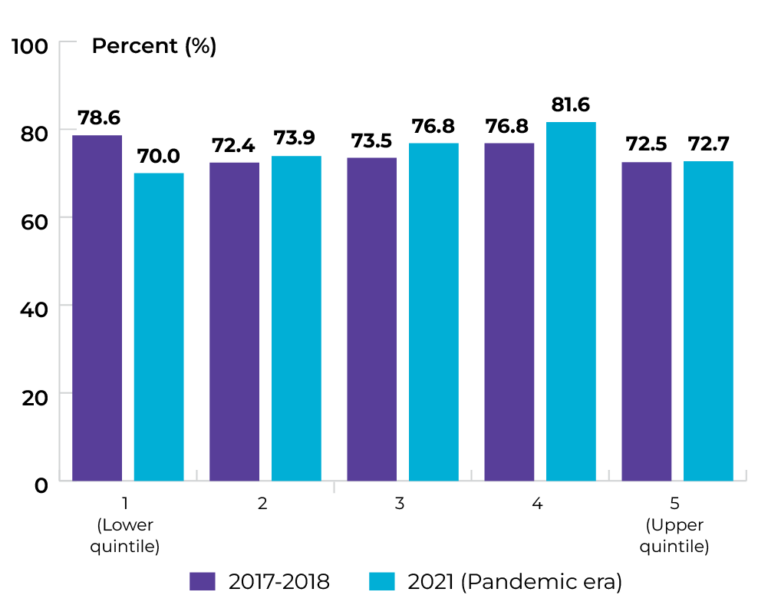
Data source: Canadian Community Health Survey
Priority 1 Action 2: Adopt proven practices known to reduce the risk of cancer
Topic: Increasing HPV vaccination
Title of image: Percentage of Grade 6 students in NL who received a final dose of HPV vaccination
Caveats/limitations:
- For students who attended Grade 6 for 2019-20 school year, data also includes those who received their final dose through catch-up vaccination up to September 2023.
- Assumption that the 2008 birth cohort exclusively attended Grade 6 in 2019-20 school year.
- The COVID-19 pandemic could have impacted fully immunized cases during the school year 2019-20.
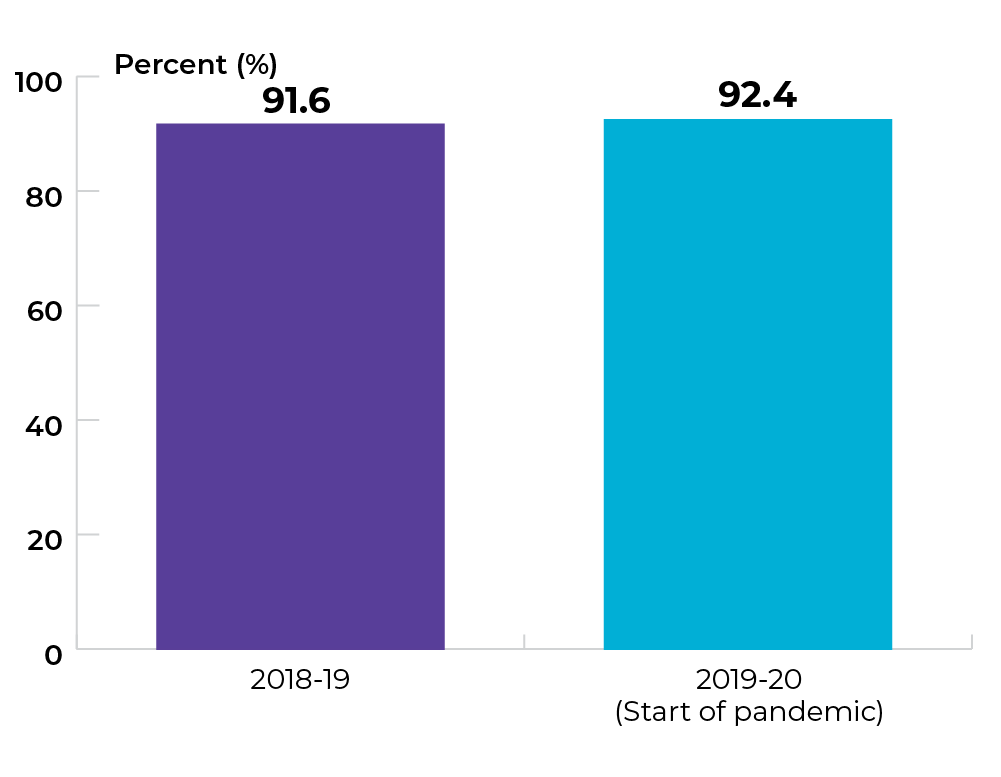
Data source: Provincial cancer agencies and programs
Topic: Increasing HPV vaccination
Title of image: Percentage of Grade 6 students in NL who received a final dose of HPV vaccination in the 2019-20 school year, by sex
Caveats/limitations:
- For students who attended Grade 6 for 2019-20 school year, data also includes those who received their final dose through catch-up vaccination up to September 2023.
- Assumption that the 2008 birth cohort exclusively attended Grade 6 in 2019-20 school year.
- The COVID-19 pandemic could have impacted fully immunized cases during the school year 2019-20.
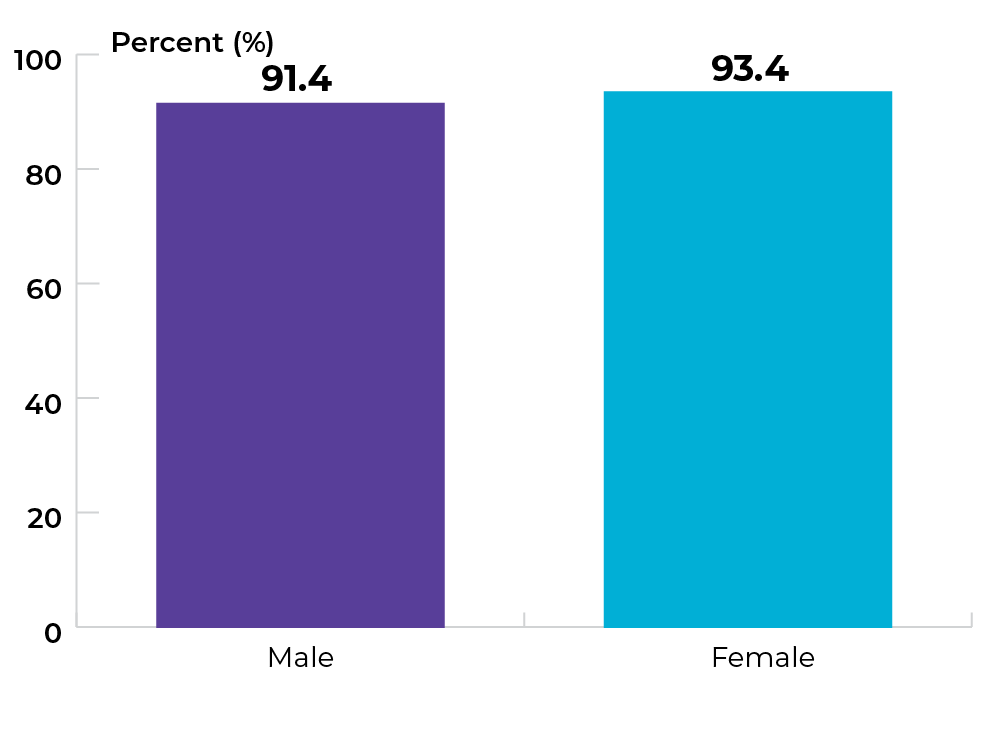
Data source: Provincial cancer agencies and programs
Topic: Increasing genetic testing
Title of image: Percentage of patients in NL under 40 years of age diagnosed with colorectal cancer who received genetic testing within one year of diagnosis
Caveats/limitations:
- 2017-19 years were aggregated as number of colon cases per year were too small to report.
- The COVID-19 pandemic may have affected service provision.
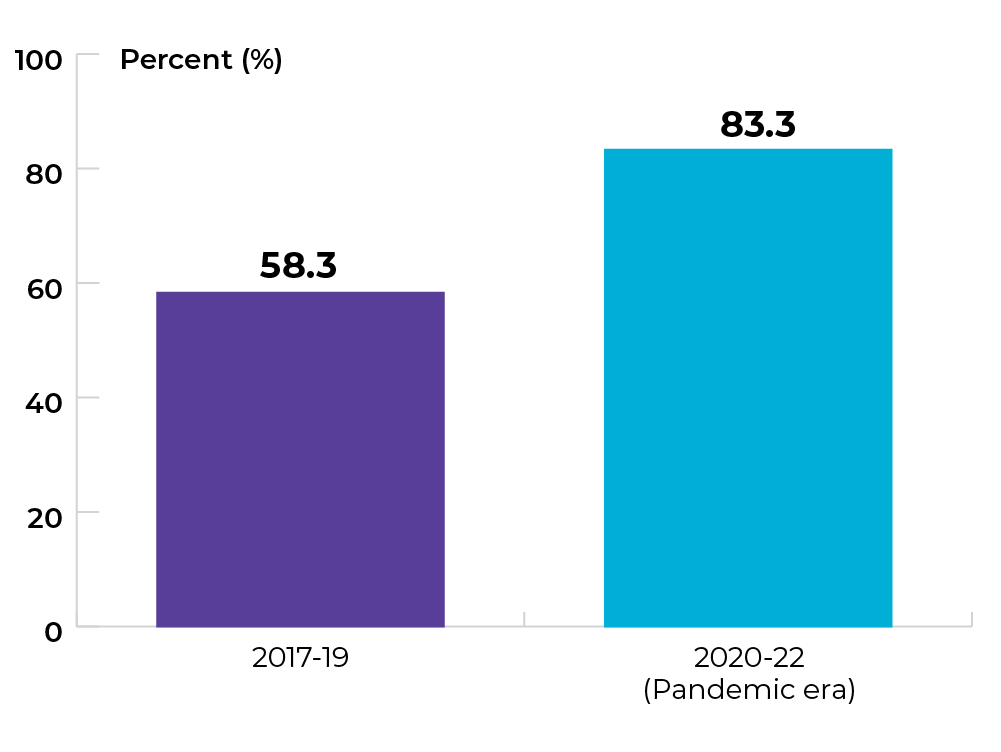
Data source: Provincial cancer agencies and programs
Priority 2 Action 1: Prioritize rapid access to appropriate diagnosis for those suspected of having cancer
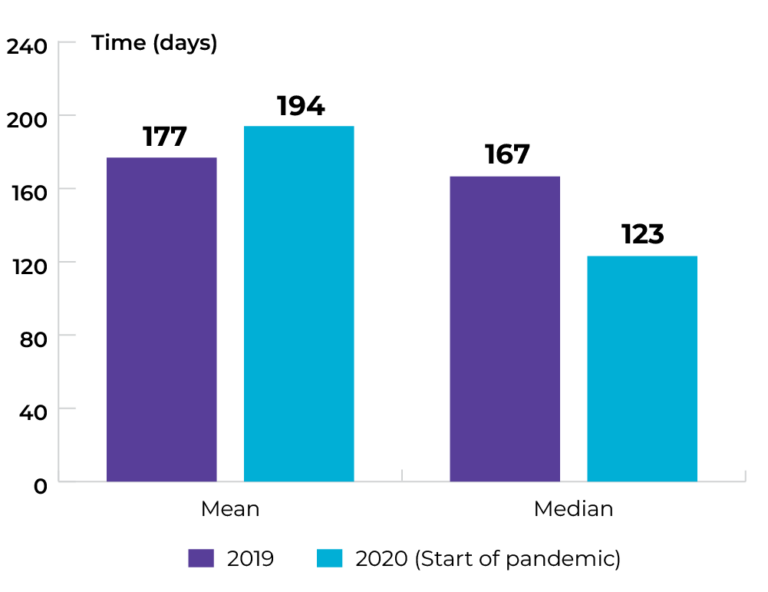
Topic: Reducing wait for diagnosis
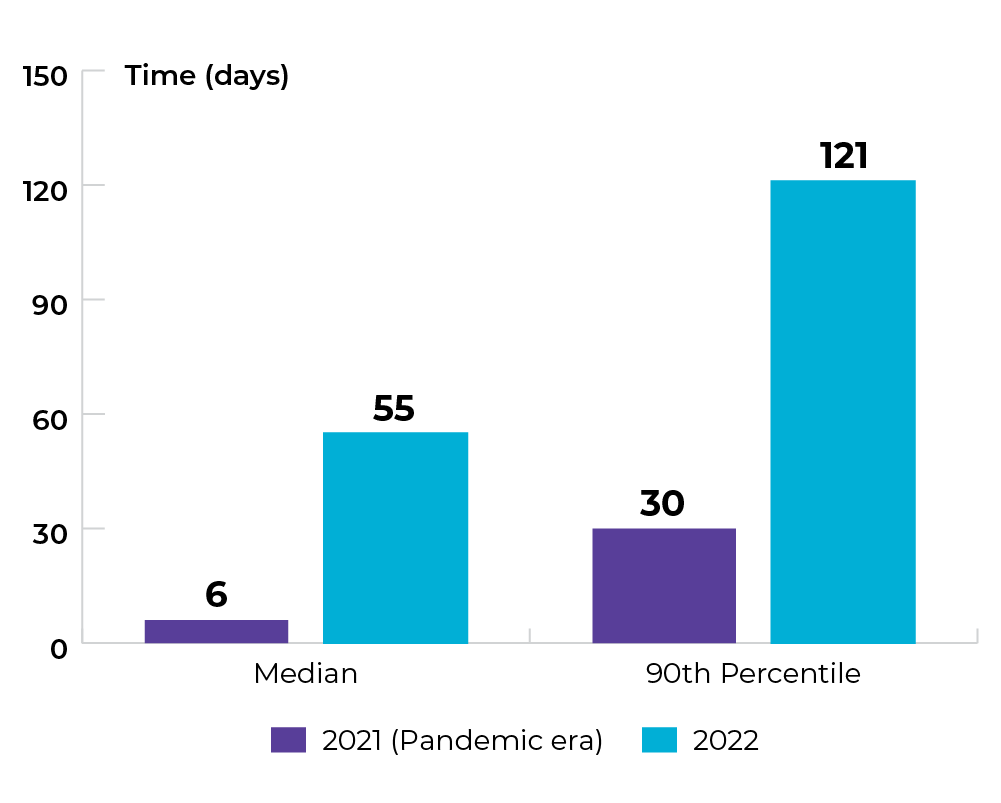
Title of image: Median and 90th percentile from time (days) from positive FIT test to diagnosis of colorectal cancer
Caveats/limitations:
- In comparison to 2021, there were longer wait times seen in 2022 due to capacity issues within the system which affected higher times (days).
- 19 days was the average time from positive FIT test to diagnosis of colorectal cancer in 2021, and 61 days was the average time from positive FIT test to diagnosis of colorectal cancer in 2022.
- The COVID-19 pandemic may have affected service provision.
Data source: Provincial cancer agencies and programs
Topic: Diagnosing cancer earlier
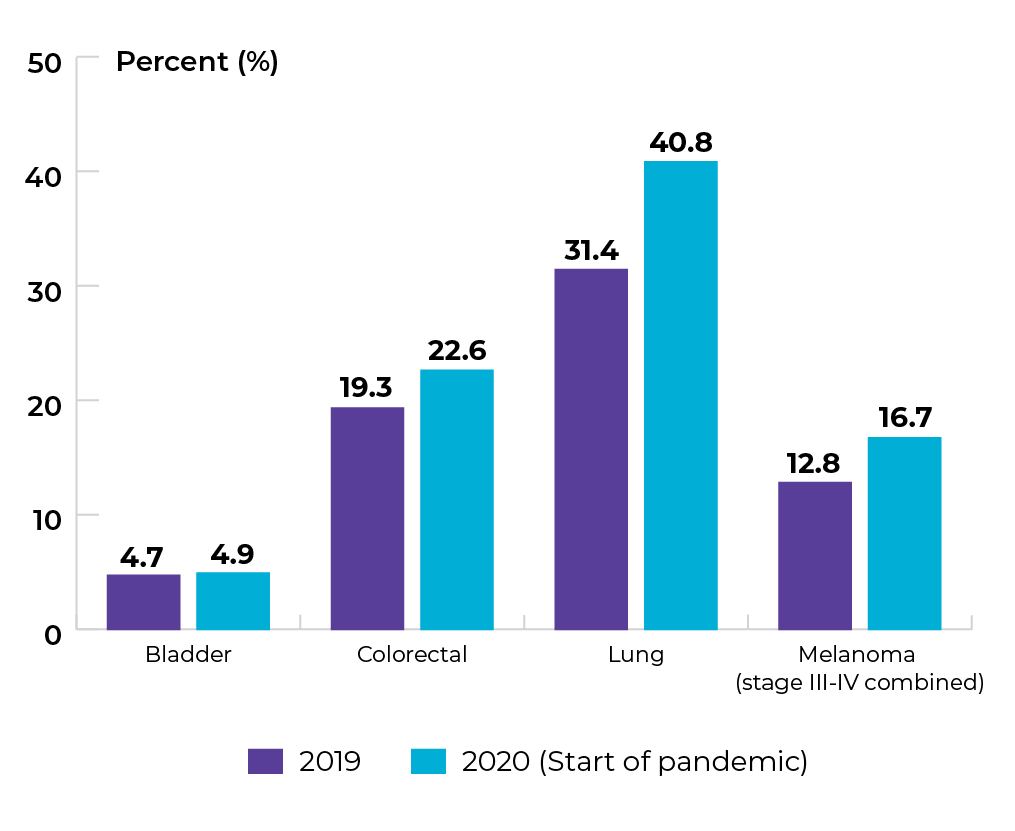
Title of image: Proportion of stage 4 diagnosis in NL
Data source: Provincial cancer agencies and programs
Priority 2 Action 2: Strengthen existing screening efforts and implement lung cancer screening programs across the country
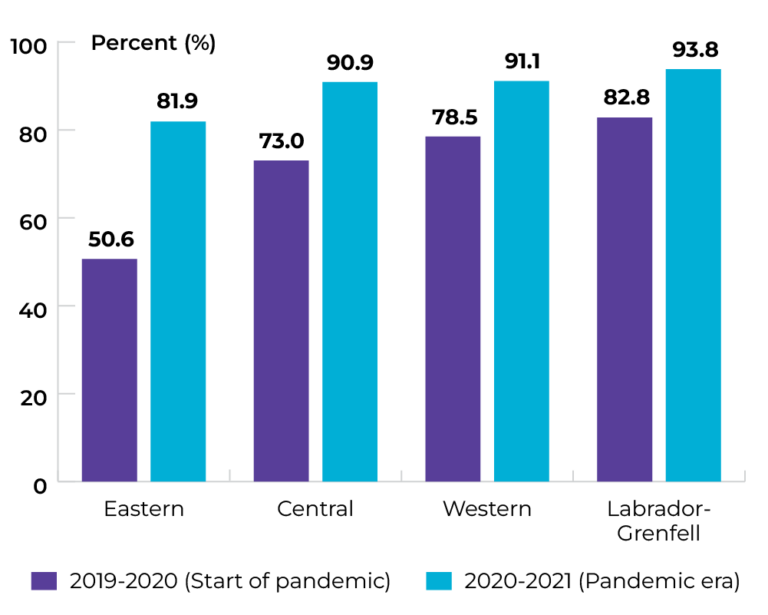
Topic: Increasing participation in colorectal cancer screening
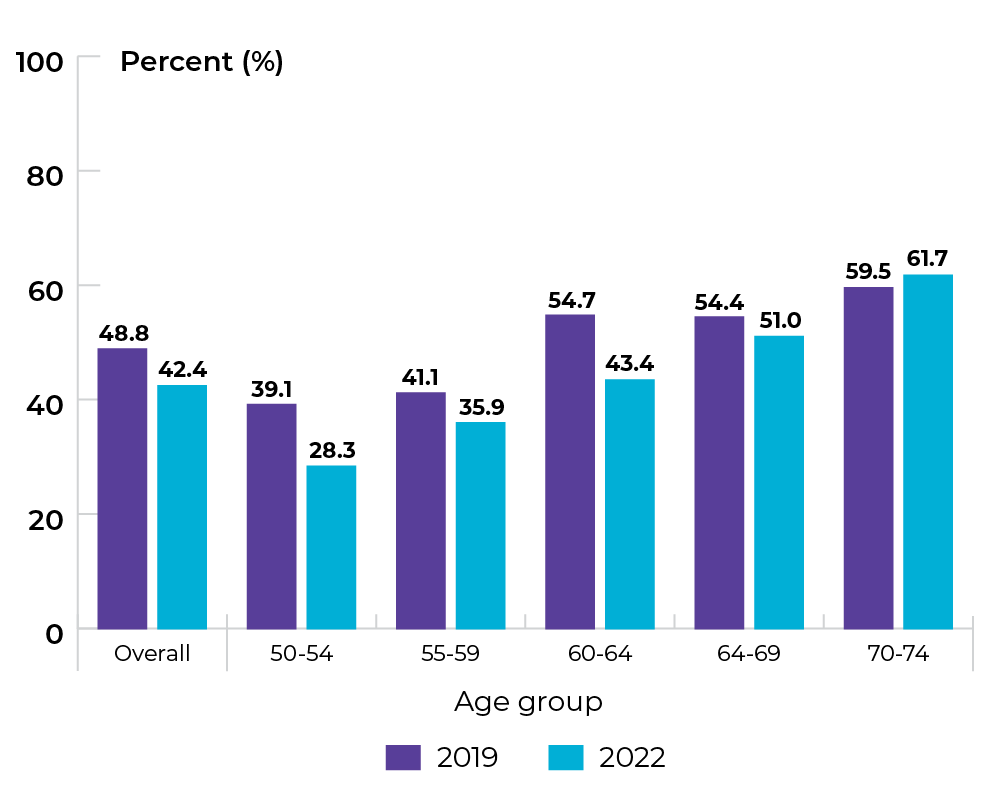
Title of image: Percentage of individuals in NL who had a successful FIT result in 2 years or a colonoscopy in 5 years
Caveats/limitations:
- When interpreting the graph below, note that the label “2019” represents successful FIT test results received from 2018-19 and successful colonoscopies from 2015-19. The label “2022” represents successful FIT test results received from 2020-21 and successful colonoscopies from 2018-22 as these years/cohorts best match the cycle of testing.
- The COVID-19 pandemic may have affected service provision.
 Data source: Provincial cancer agencies and programs
Topic: Increasing participation in colorectal cancer screening
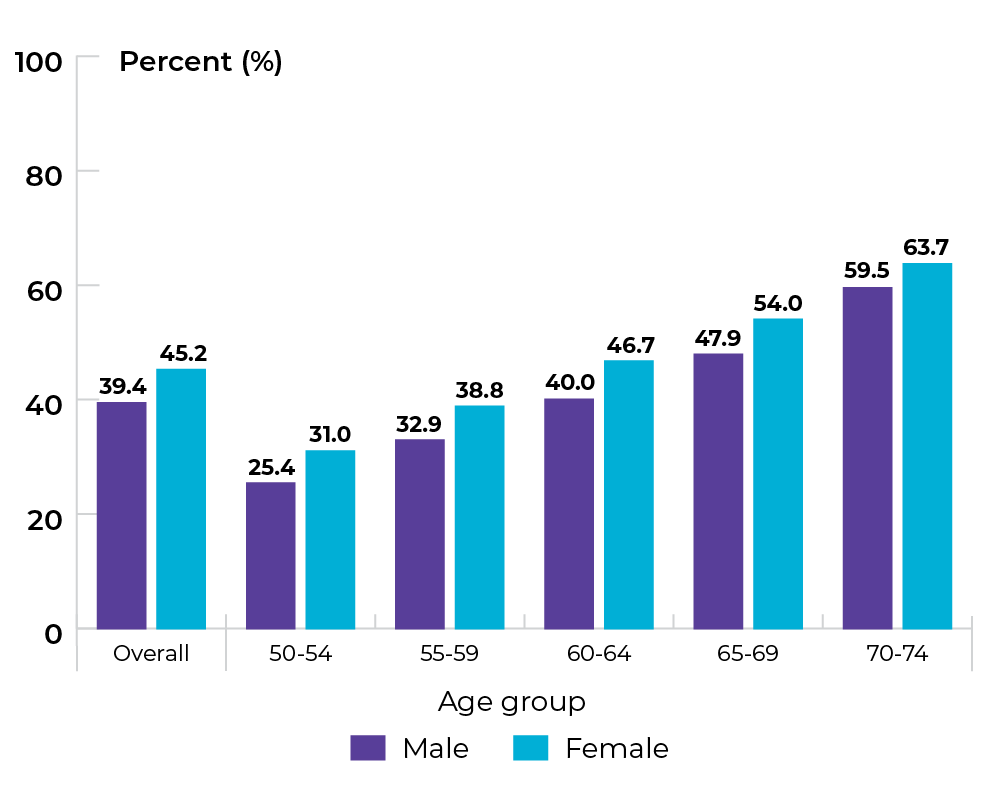
Title of image: Percentage of individuals in NL who had a successful FIT result in 2 years or a colonoscopy in 5 years for 2022, by sex
Caveats/limitations: The COVID-19 pandemic may have affected service provision.
 Data source: Provincial cancer agencies and programs
Priority 3 Action 1: Set best practices and standards for care delivery and promote their adoption
Topic: Implementing multidisciplinary care
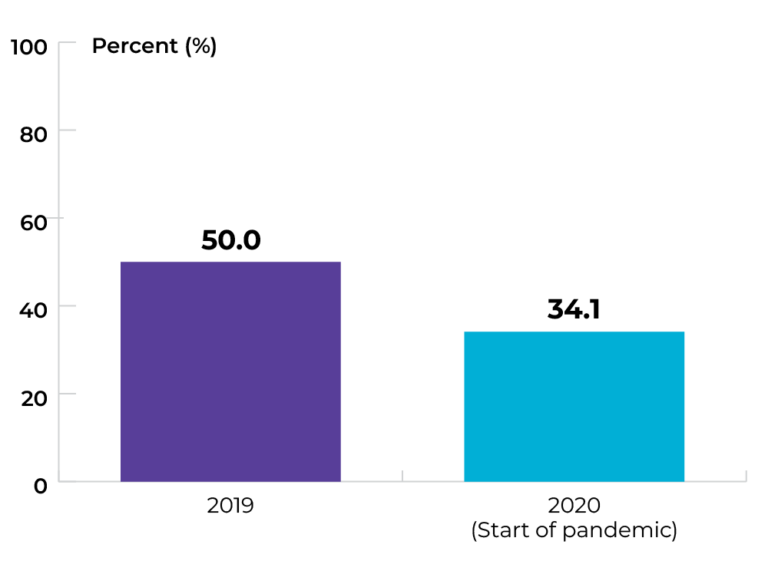
Title of image: Percentage of patients in NL diagnosed with stages 1 to 3 rectal cancer that were discussed at least one time at a Gastrointestinal (GI) tumour board committee
Caveats/limitations:
- A patient may have been discussed multiple times at a tumour board over the specified time period. This indicator does not capture the frequency of discussions but rather whether a patient was discussed at least one time.
- For the gastrointestinal tumour board, there is not currently a benchmark for this indicator or criteria for those cases that must be discussed. In general, cases where there are ambiguities about staging, difference of opinion regarding management or uncertainties about the best line of management are brought forth by the attending or triaging physician voluntarily.
- The COVID-19 pandemic may have affected service provision.
Data source: Provincial cancer agencies and programs
Topic: Implementing multidisciplinary care
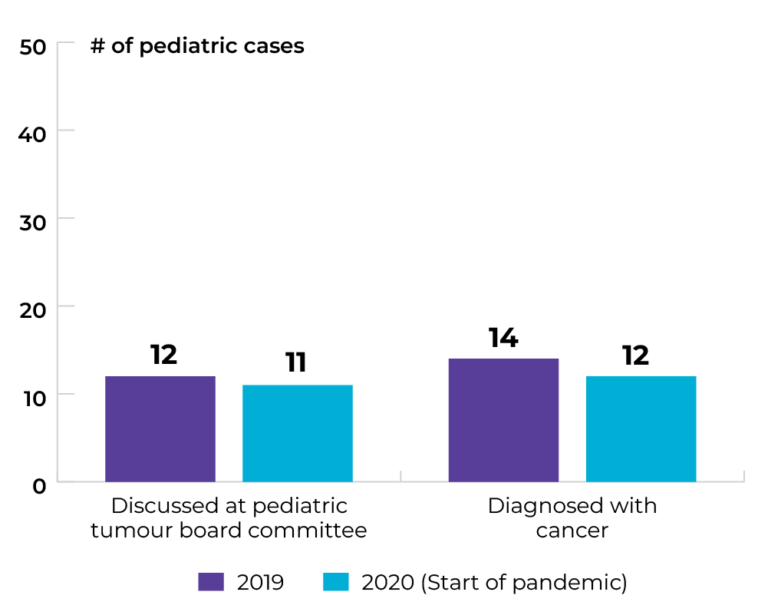
Title of image: Number of pediatric patients in NL discussed at tumour board committee and pediatric patients diagnosed in the same year
Caveats/limitations: The COVID-19 pandemic may have affected service provision.
Data source: Provincial cancer agencies and programs
Priority 3 Action 2: Eliminate low-benefit practices and adopt high-value practices
Topic: Optimizing care at end of life
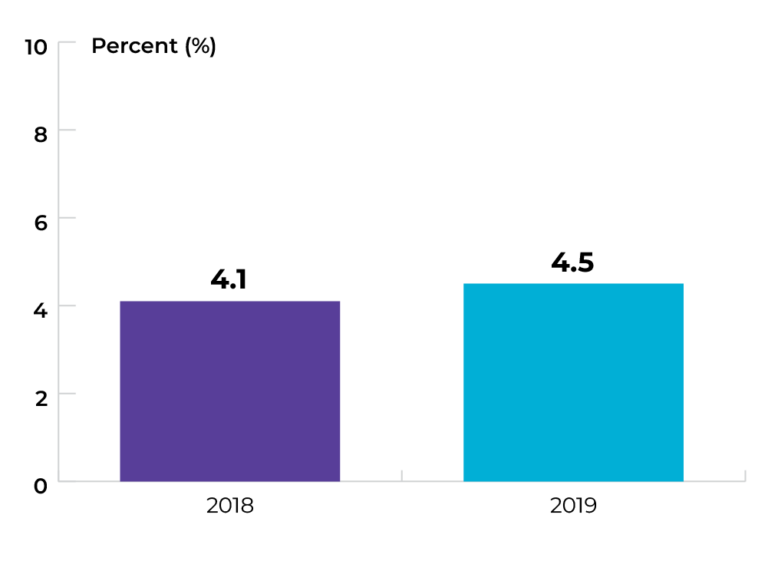
Title of image: Percentage of patients diagnosed with invasive cancer and died who received chemotherapy in the last two weeks of life
Caveats/limitations: There is currently no way to determine the cause of death, and there was therefore no way to exclude deaths unrelated to cancer from the denominator.
Data source: Provincial cancer agencies and programs
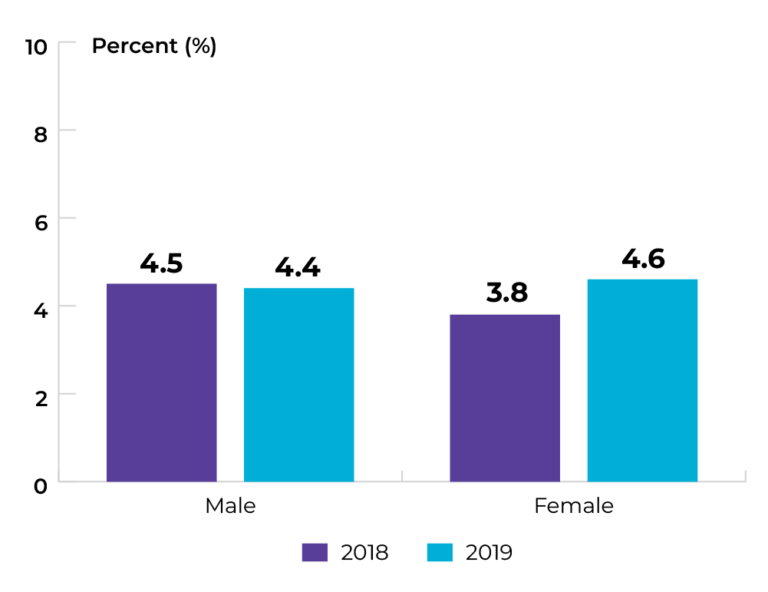
Topic: Optimizing care at end of life
Title of image: Percentage of patients diagnosed with invasive cancer and died who received chemotherapy in the last two weeks of life
Data source: Provincial cancer agencies and programs
Topic: Optimizing screening and appropriate follow-up
Title of image: Percentage of people with a cervix who had a Pap smear, by age group
Caveats/limitations: The COVID-19 pandemic may have affected service provision.
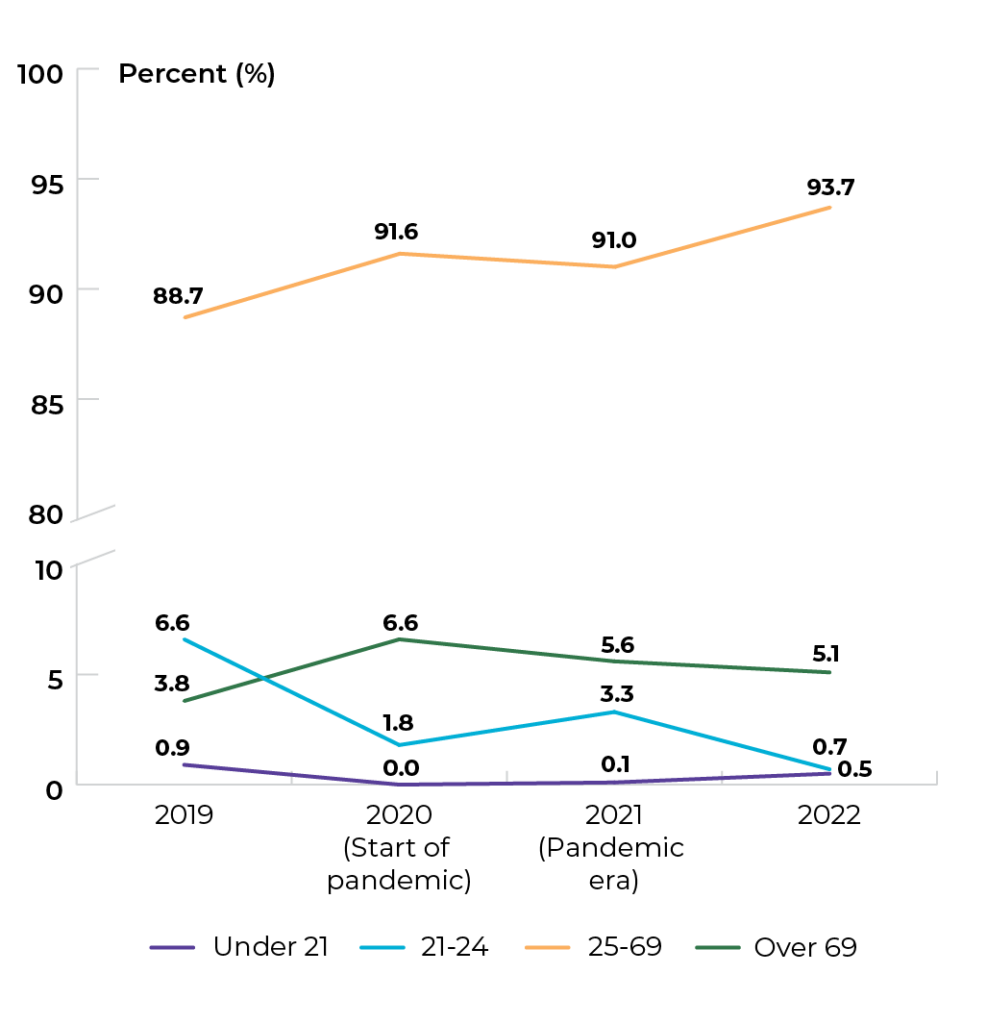
Title of table: Percentage of people with a cervix who had a Pap smear, by age group
| Age group | 2019 | 2020 | 2021 | 2022 |
|---|---|---|---|---|
| Under 21 | 0.9% | 0.0% | 0.1% | 0.5% |
| 21-24 | 6.6% | 1.8% | 3.3% | 0.7% |
| 25-69 | 88.7% | 91.6% | 91.0% | 93.7% |
| Over 69 | 3.8% | 6.6% | 5.6% | 5.1% |
Data source: Provincial cancer agencies and programs
Priority 3 Action 3: Design and implement new models of care
Topic: Expanding models of care
Title of image: Percentage of new patients with cancer who were current smokers and received a referral to the smoking cessation program
Caveats/limitations:
- The Smoking Cessation Program runs one morning per week and provides patients with a combination of behavioural therapy and prescription and non-prescription medications. In the past, this was an in-person program, which was only offered in the province’s cancer clinics. Since the COVID-19 pandemic, the program has become telephone-based only and has seen an increase in compliance.
- The COVID-19 pandemic may have affected service provision.
Data source: Provincial cancer agencies and programs
Priority 4 Action 1: Provide better services and care adapted to the specific needs of underserved groups
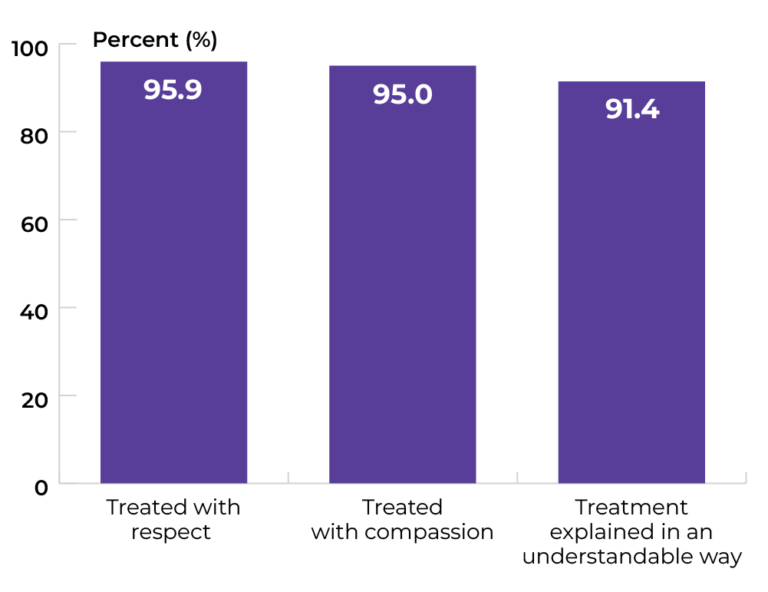
Topic: Increasing access to culturally safe care
Title of image: Percentage of patients who reported that they were treated with respect, compassion and treatment was explained in an understandable way
Caveats/limitations:
- The COVID-19 pandemic may have affected service provision.
- Experience of Care Questionnaire was administered to Cancer Care patients January 18 to April 30, 2021. Response rate was 23.4% (N=484) and 89.2% (n=430) answered the questionnaire as the patient while 10.8% (n=54) responded as the patient’s family member.
- This Questionnaire did not collect the ethnicity of its respondents.
- The plan is to re-administer this Questionnaire in 2025.
Data source: Provincial cancer agencies and programs
Priority 4 Action 2: Ensure rural and remote communities have the resources required to better serve their people
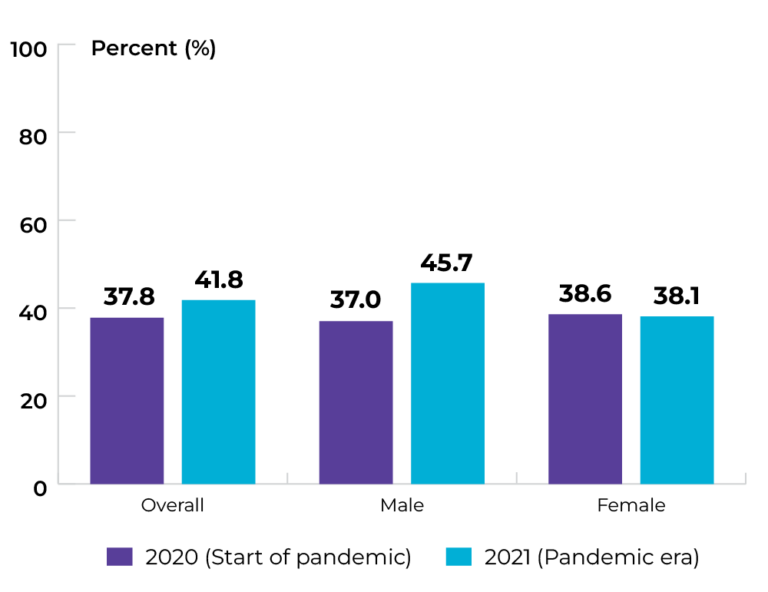
Topic: Increasing access to virtual care
Title of image: Percentage of patients with cancer from rural/remote communities using virtual health appointment
Caveats/limitations: The COVID-19 pandemic may have affected service provision.
 Data source: Provincial cancer agencies and programs
Topic: Increasing access to virtual care
Title of image: Percentage of patients with cancer from rural/remote communities using virtual health appointment
Caveats/limitations: The COVID-19 pandemic may have affected service provision.
Data source: Provincial cancer agencies and programs
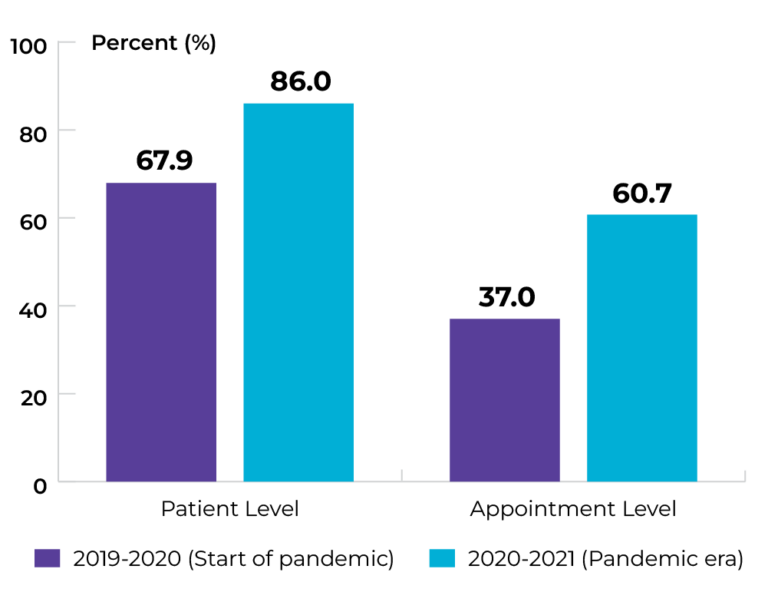
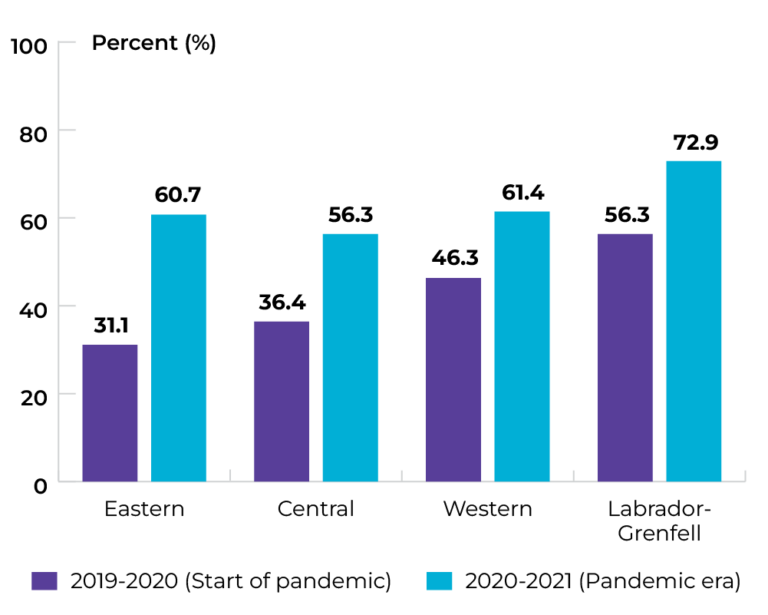
Topic: Increasing access to virtual care
Title of image: Percentage of cancer appointments from rural/remote communities using virtual health appointment
Caveats/limitations: The COVID-19 pandemic may have affected service provision.
Data source: Provincial cancer agencies and programs
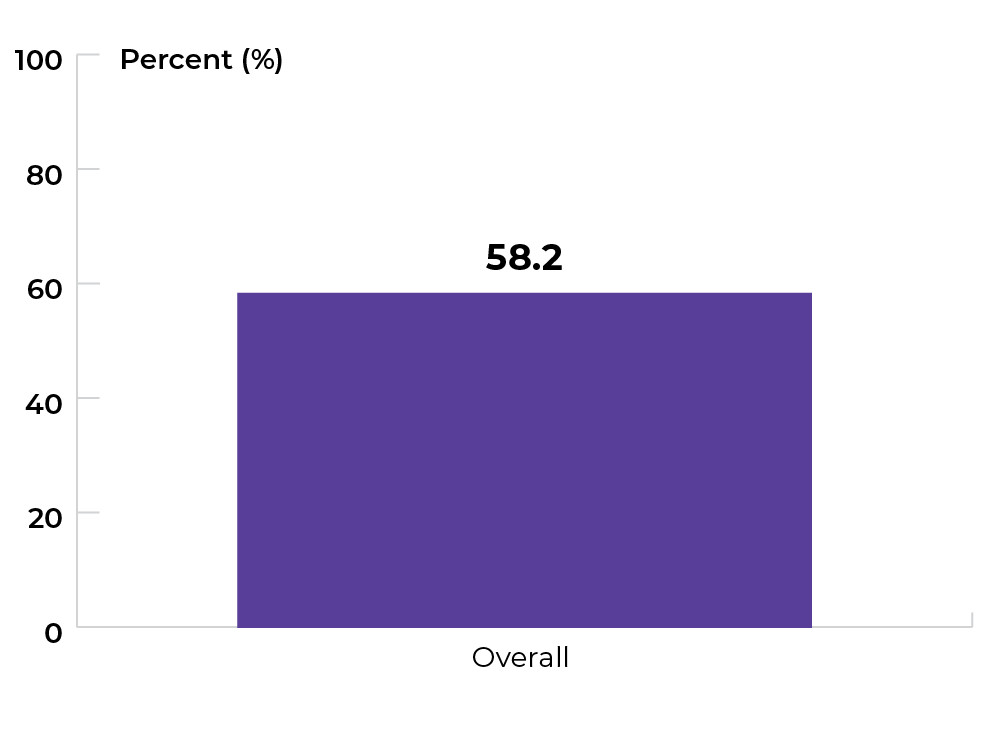
Topic: Increasing access to supportive care services
Title of image: Percentage of patients diagnosed with cancer in 2022 who reside outside of the St. John’s census metropolitan area and accessed Social Work and/or Nutrition Services
Caveats/limitations:
- Patients who accessed Social Work and/or Nutrition Services were primary malignant neoplasms diagnosed cases.
- All Cancer Care Programs’ Social Workers and Dietitians are located in the St. John’s except 1 Social Worker is located in Corner Brook site.
- The COVID-19 pandemic may have affected service provision.
Data source: Provincial cancer agencies and programs
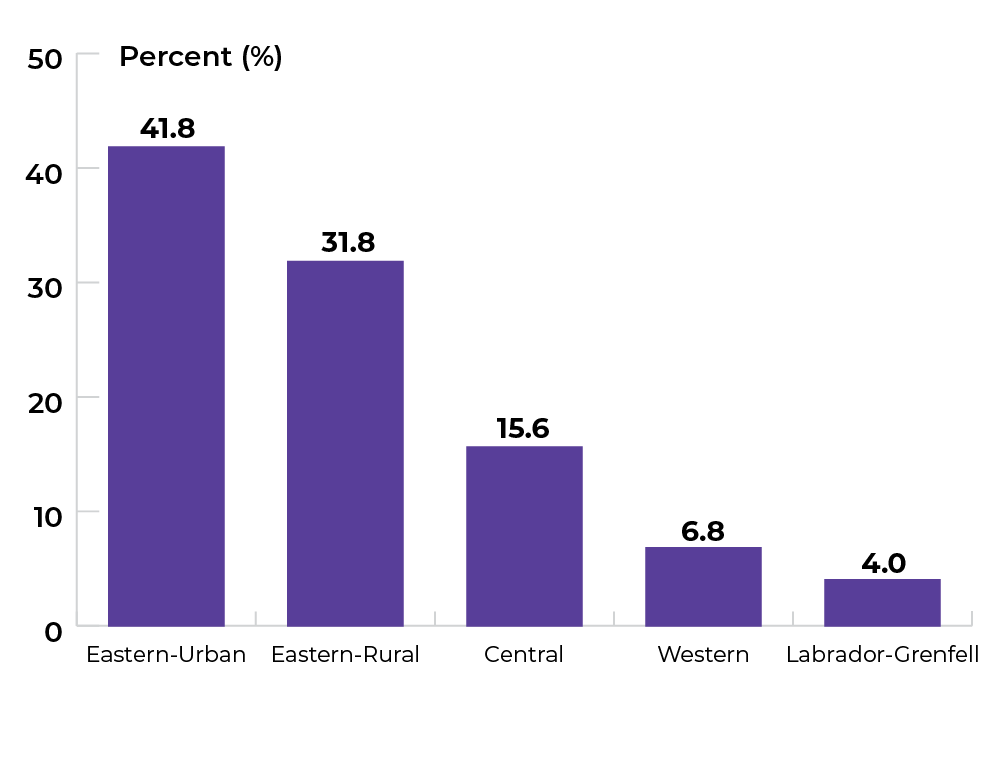
Topic: Increasing access to supportive care services
Title of image: Percentage of patients diagnosed with cancer in 2022 who reside in each of Newfoundland and Labrador’s Health Zones and accessed Social Work and/or Nutrition Services
Caveats/limitations:
- Patients who accessed Social Work and/or Nutrition Services were primary malignant neoplasms diagnosed cases.
- All Cancer Care Programs’ Social Workers and Dietitians are located in the St. John’s except 1 Social Worker is located in Corner Brook site.
- The COVID-19 pandemic may have affected service provision.
Data source: Provincial cancer agencies and programs
Priority 4 Action 3: Ensure care can be delivered between provinces, territories and federal jurisdictions when needed
Topic: Improving access to timely care for people who need to travel between jurisdictions
Title of image: Average wait time (in days) for patients with cancer who required Allogeneic Stem Cell Transplant (ASCT) treatment outside of their home jurisdiction
Caveats/limitations:
- All patients from NL must leave the province for Allogeneic Stem Cell Transplantation.
- Chemotherapy is required to prepare for allogeneic stem cell transplantation. As such, patients must spend about one week receiving chemotherapy before transplantation, making the minimum possible wait time the time for chemotherapy + travel.
- The COVID-19 pandemic may have affected service provision.
Data source: Provincial cancer agencies and programs
Priority 5 Action 1: Integrate the full spectrum of information and support services to ensure people are fully supported throughout the cancer experience
Topic: Improving availability of information and support
Title of image: Percentage of cancer patients who reported that they were given enough information about their cancer, its treatments, and the outcome of their cancer
Caveats/limitations:
- Experience of Care Questionnaire was administered to Cancer Care patients January 18 to April 30, 2021. Response rate was 23.4% (N=484) and 89.2% (n=430) answered the questionnaire as the patient while 10.8% (n=54) responded as the patient’s family member.
- The plan is to re-administer this Questionnaire in 2025
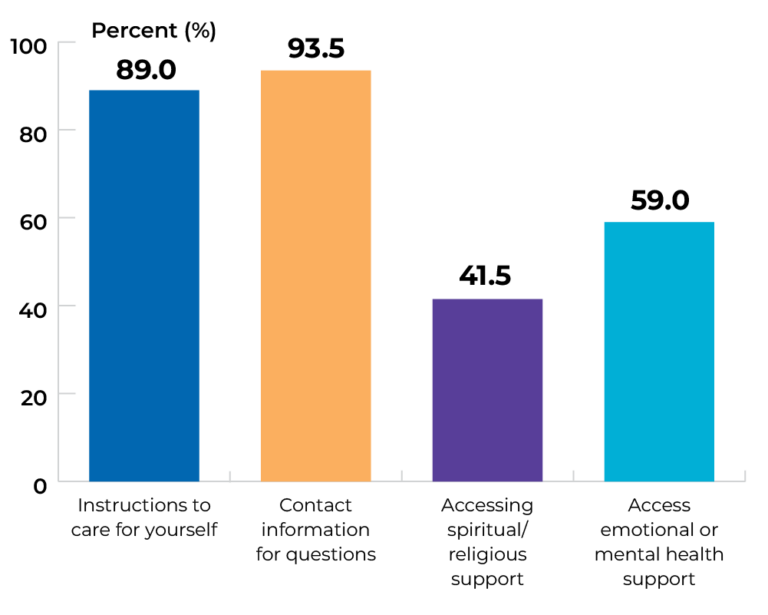
Data source: Provincial cancer agencies and programs
Topic: Improving access to shared medical records
Title of image: Percentage of family physicians in NL who have logged into HEALTHeNL viewer at least 50 times (among family physicians who have access to HEALTHeNL)
Caveats/limitations:
- Information on patients with cancer is available but it cannot be separated from other patients without cancer at this time. This is a proxy indicator and does not measure access to electronic cancer care information directly. Rather, it measures access to general EMRs, where cancer information is a subset.
- The COVID-19 pandemic may have affected service provision.
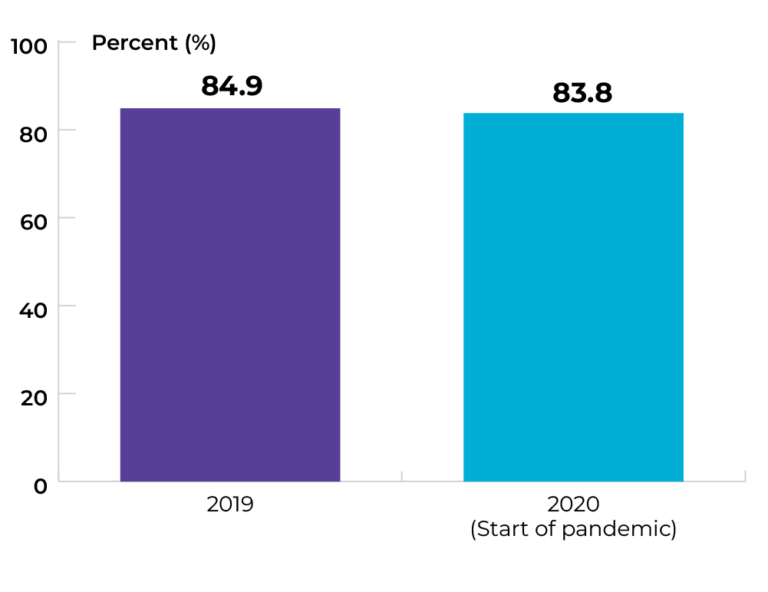 Data source: Provincial cancer agencies and programs
Topic: Improving access to shared medical records
Title of image: Percentage of family physicians in NL who have logged into HEALTHeNL viewer at least 50 times (among family physicians that have access to HEALTHeNL), by regional health authority
Caveats/limitations: The COVID-19 pandemic may have affected service provision.
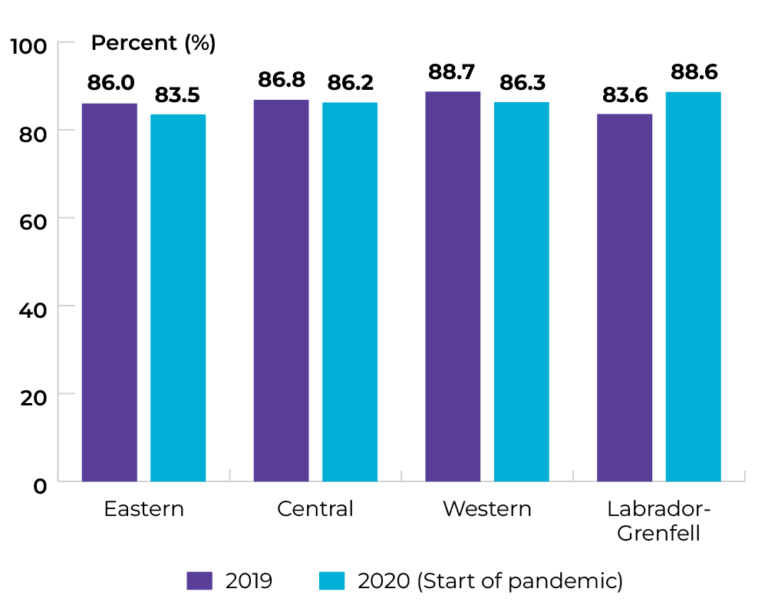 Data source: Provincial cancer agencies and programs
Priority 5 Action 2: Address the limited and unequal access to palliative and end-of-life care across Canada
Topic: Improving access to quality end-of-life care
Title of image: Cumulative length of stay for cancer patients (overall) who were in or admitted to an acute care hospital 30 days prior to death across NL
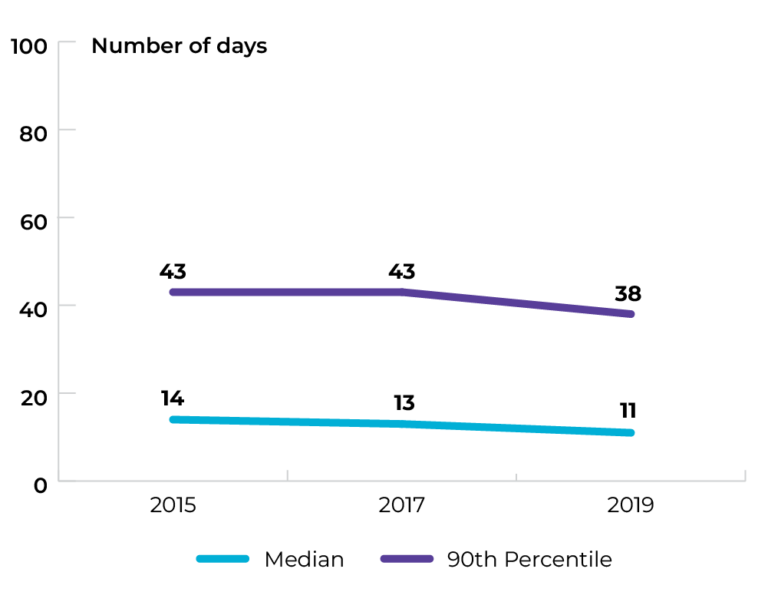
Data source: Canadian Institute for Health Information (CIHI), Discharge Abstract Database (DAD)
Topic: Improving access to quality end-of-life care
Title of image: Cumulative length of stay for cancer patients (rural/remote) who were in or admitted to an acute care hospital 30 days prior to death across NL
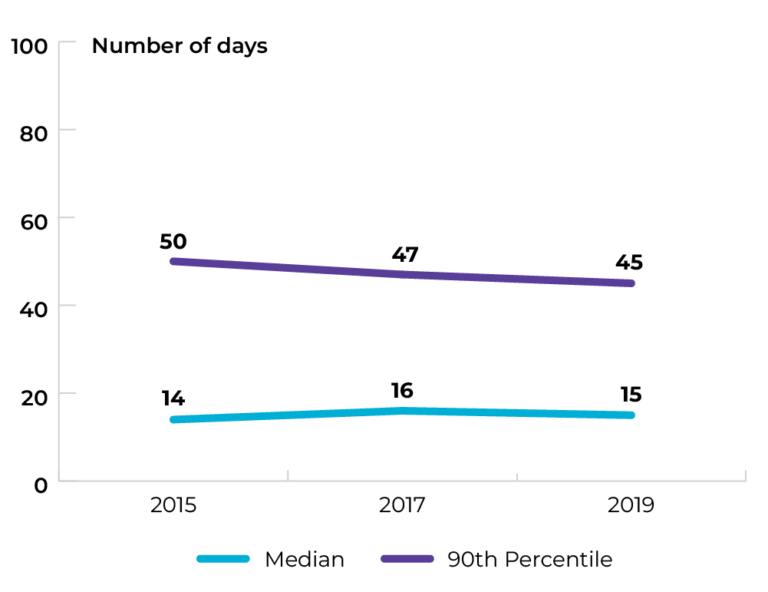
Data source: Canadian Institute for Health Information (CIHI), Discharge Abstract Database (DAD)
Topic: Improving access to quality end-of-life care
Title of image: Cumulative length of stay for cancer patients (urban) who were in or admitted to an acute care hospital 30 days prior to death across NL
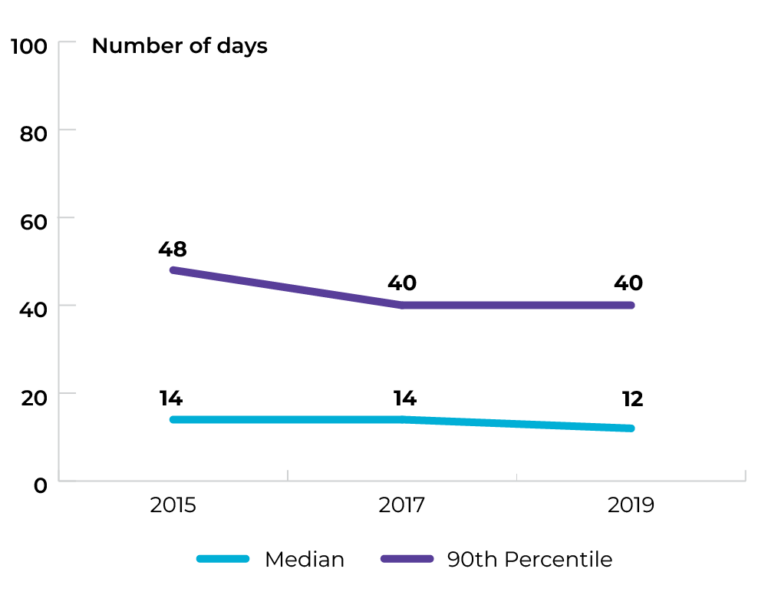
Data source: Canadian Institute for Health Information (CIHI), Discharge Abstract Database (DAD)
Topic: Improving access to culturally safe palliative care
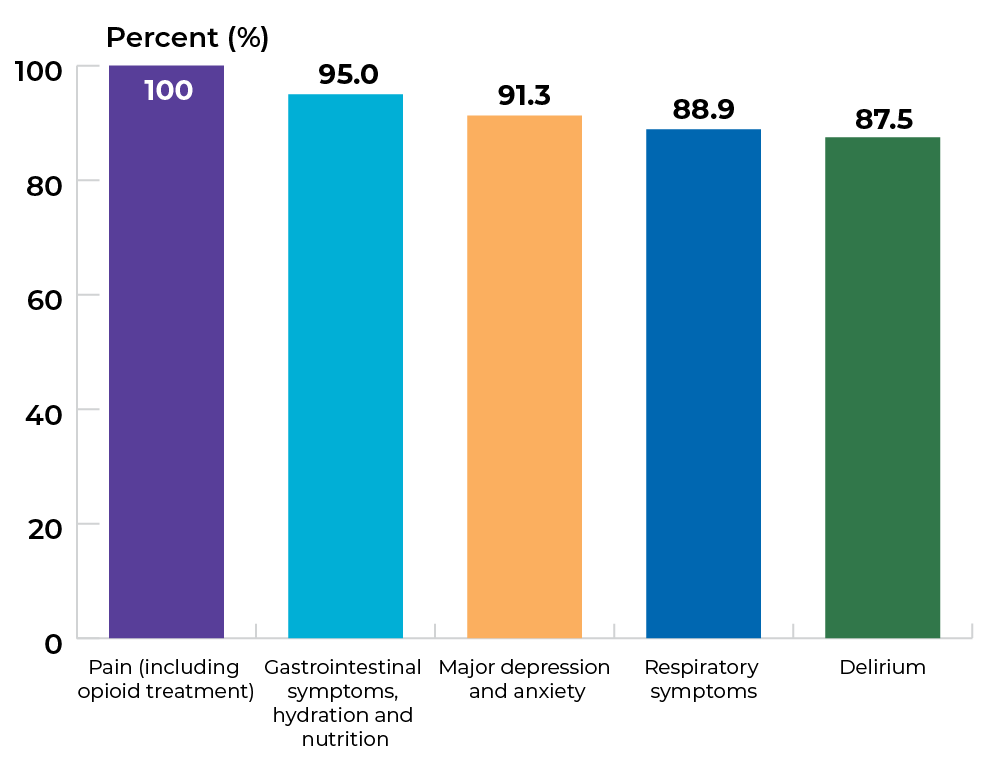
Title of image: Percentage of healthcare providers who completed the Learning Essential Approaches to Palliative Care training who had knowledge of the following competencies one year post-training, for years 2018-21
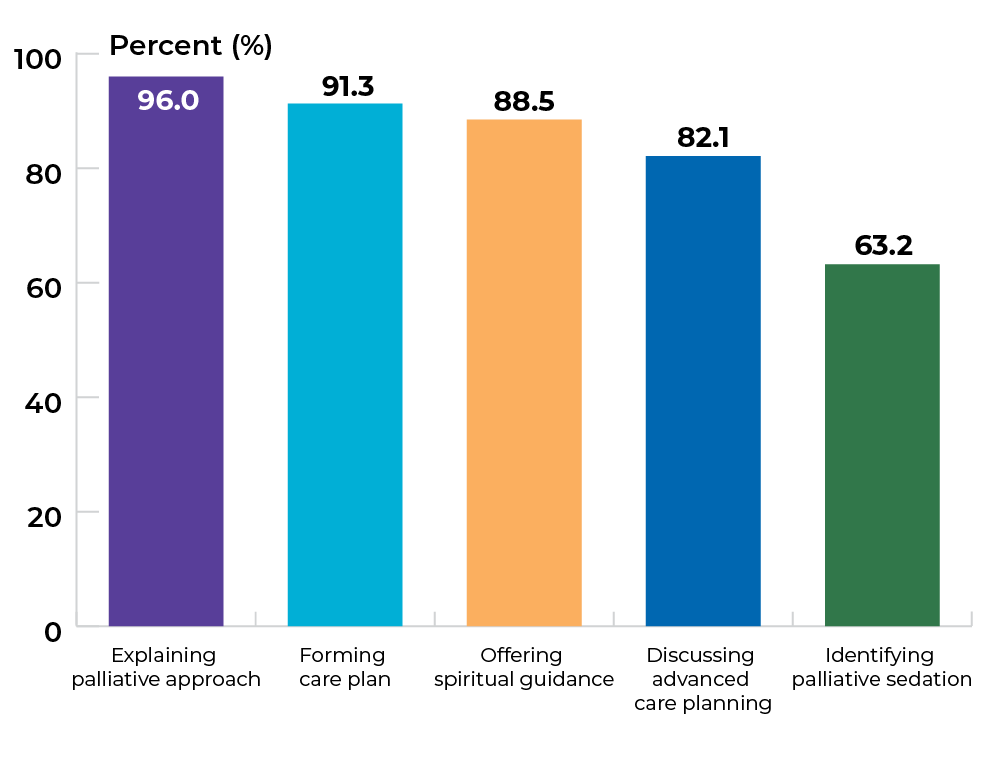
Data source: Provincial cancer agencies and programs
Topic: Improving access to culturally safe palliative care
Title of image: Percentage of healthcare providers who completed the Learning Essential Approaches to Palliative Care training who had knowledge of the following competencies one year post-training, for years 2018-21
Data source: Provincial cancer agencies and programs
The data tables and technical appendix for all indicators are available upon request at info@partnershipagainstcancer.ca. You will receive a response in two to three business days.