Supplementary data: New Brunswick
This page provides data visualizations related to the priorities for Canada’s cancer system.
The data tables and technical appendix for all indicators are available upon request at info@partnershipagainstcancer.ca.
Priority 1 Action 1: Help people to stop smoking or not start in the first place and live healthier lives
Topic: Keeping people smoke-free
Title of image: Percentage of individuals in NB (aged ≥ 12) classified as daily or occasional smokers
Caveats/limitations:
- This indicator was reported using the Canadian Community Health Survey (CCHS).
- Individuals who did not respond to the required CCHS questions regarding smoking status were not included in the analysis.
- The COVID-19 pandemic had major impacts on the data collection operations and response rates for this survey.
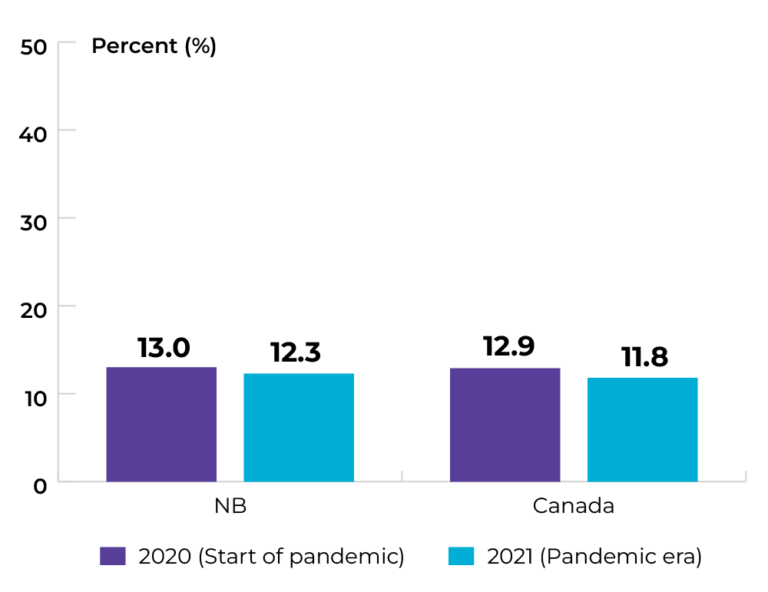
Data source: Canadian Community Health Survey
Topic: Keeping people smoke-free
Title of image: Percentage of males in NB (aged ≥ 18) classified as daily or occasional smokers, by household income quintile
Caveats/limitations: The COVID-19 pandemic had major impacts on the data collection operations and response rates for this survey.
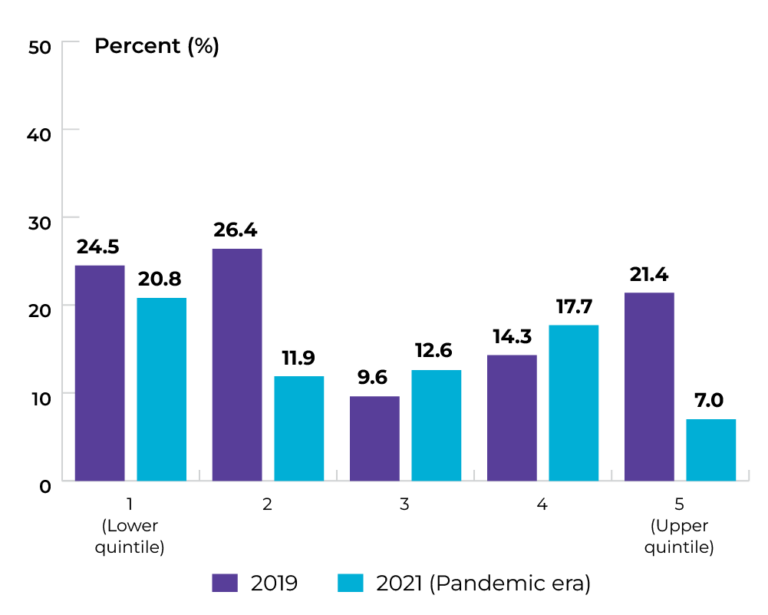 Data source: Canadian Community Health Survey
Topic: Keeping people smoke-free
Title of image: Percentage of females in NB (aged ≥ 18) classified as daily or occasional smokers, by income quintile
Caveats/limitations: The COVID-19 pandemic had major impacts on the data collection operations and response rates for this survey.
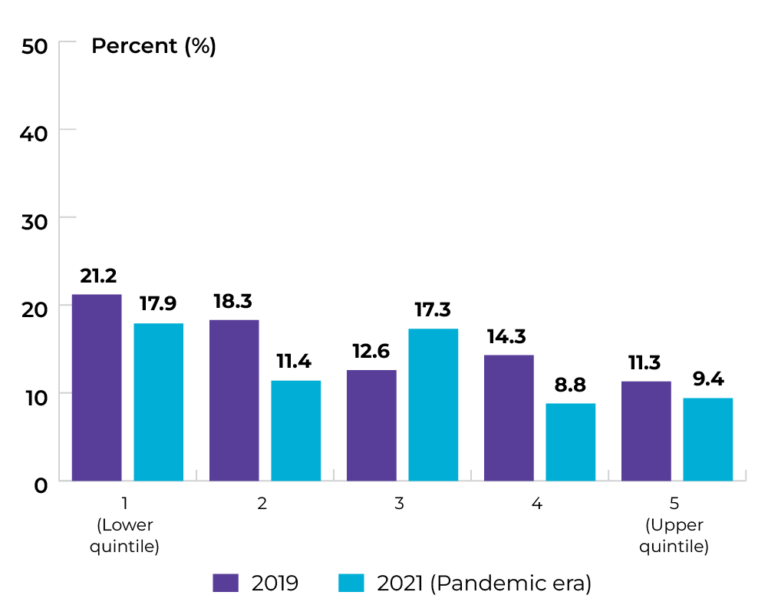
Data source: Canadian Community Health Survey
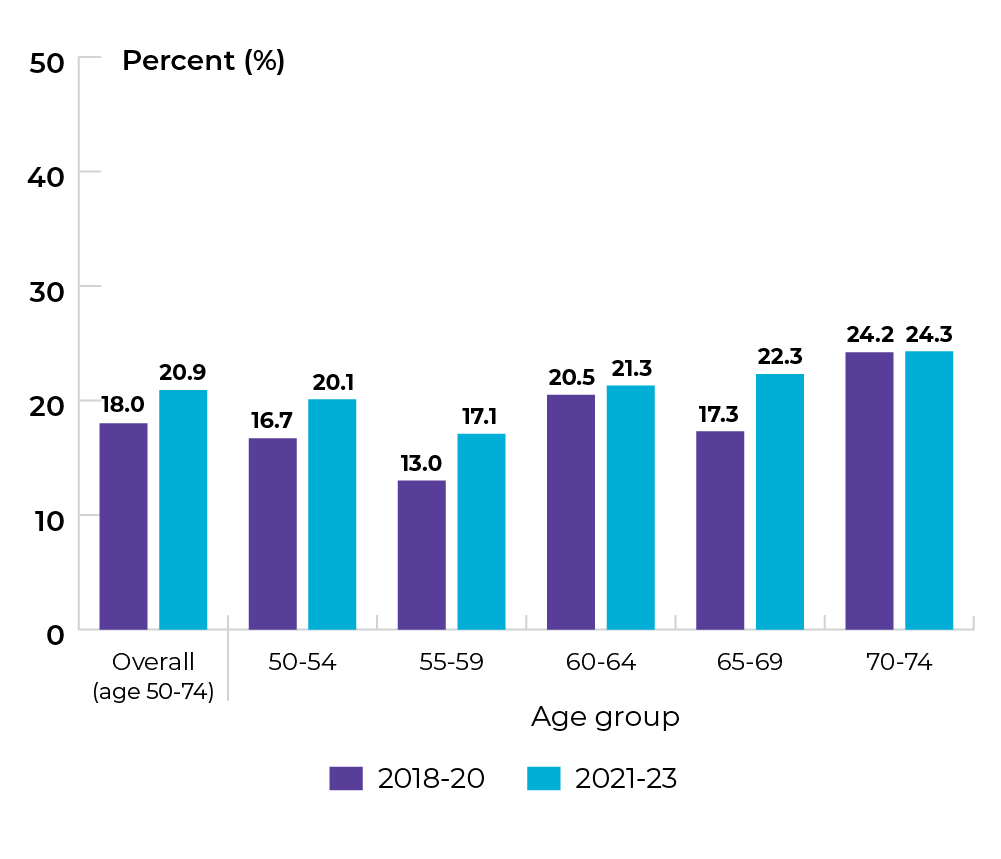
Topic: Maintaining healthy body weight
Title of image: Percentage of individuals in NB (aged ≥ 18) classified as overweight or obese
Caveats/limitations:
- Individuals who did not respond to the required CCHS questions to derive the BMI classifications were not included in the analysis.
- The COVID-19 pandemic had major impacts on the data collection operations and response rates for this survey.
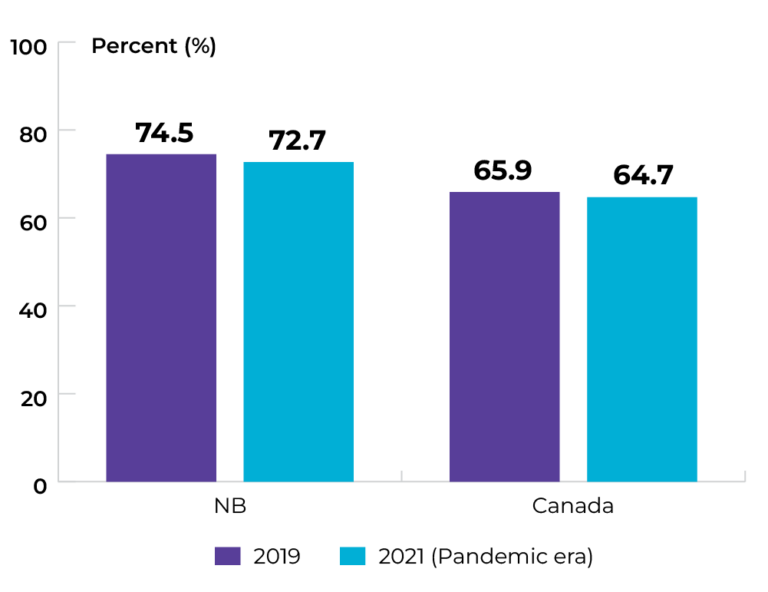
Data source: Canadian Community Health Survey
Priority 1 Action 2: Adopt proven practices known to reduce the risk of cancer
Topic: Increasing HPV vaccination
Title of image: Percentage of Grade 7 students with complete HPV series by school year and sex
Caveats/limitations: The COVID-19 pandemic may have affected service provision.
Data source: Provincial cancer agencies and programs
Priority 2 Action 1: Prioritize rapid access to appropriate diagnosis for those suspected of having cancer
Topic: Reducing wait for diagnosis
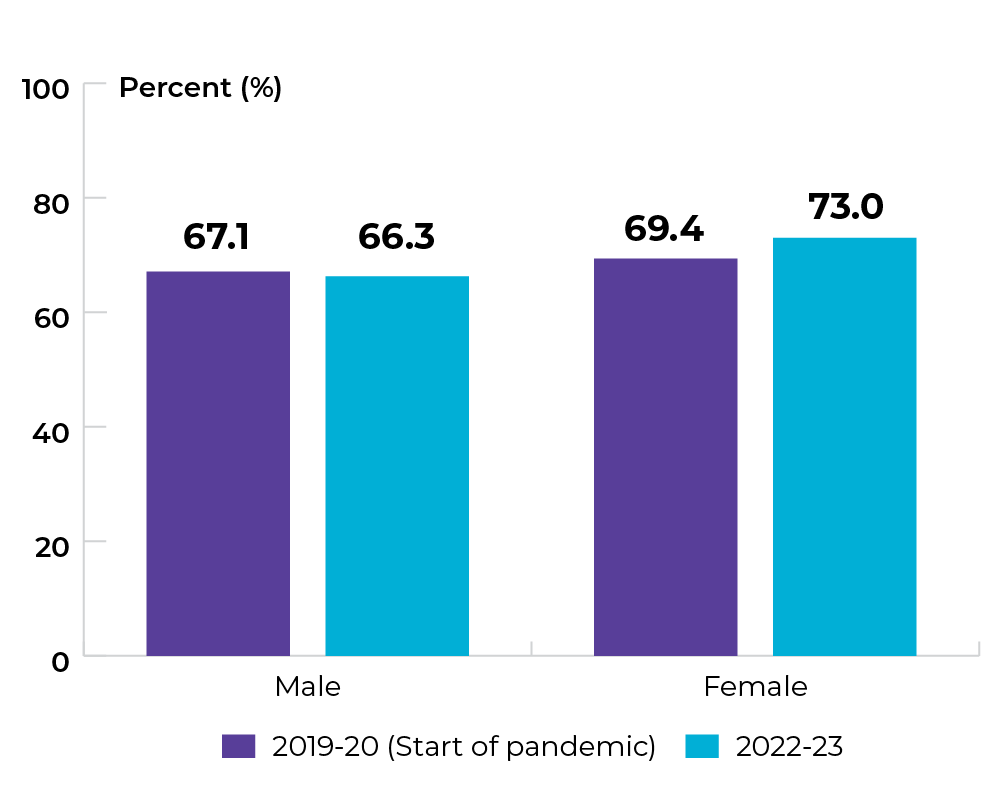
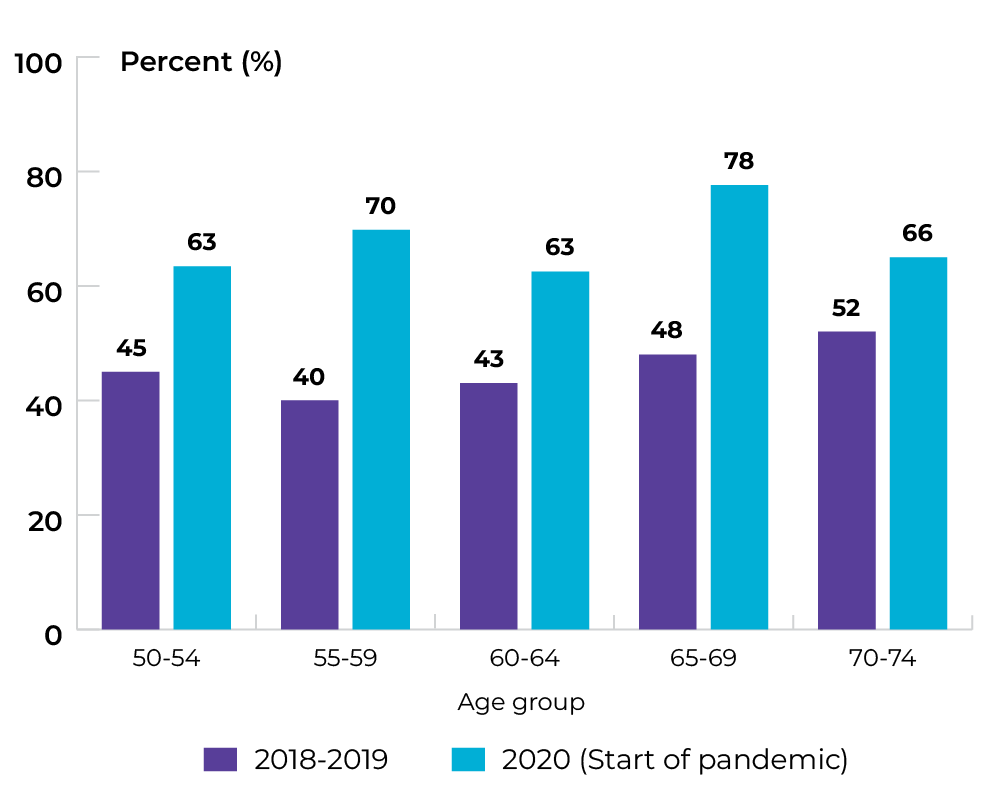
Title of image: Percentage of colonoscopies that were completed within target (60 days after an abnormal FIT)
Caveats/limitations: The COVID-19 pandemic may have affected service provision.
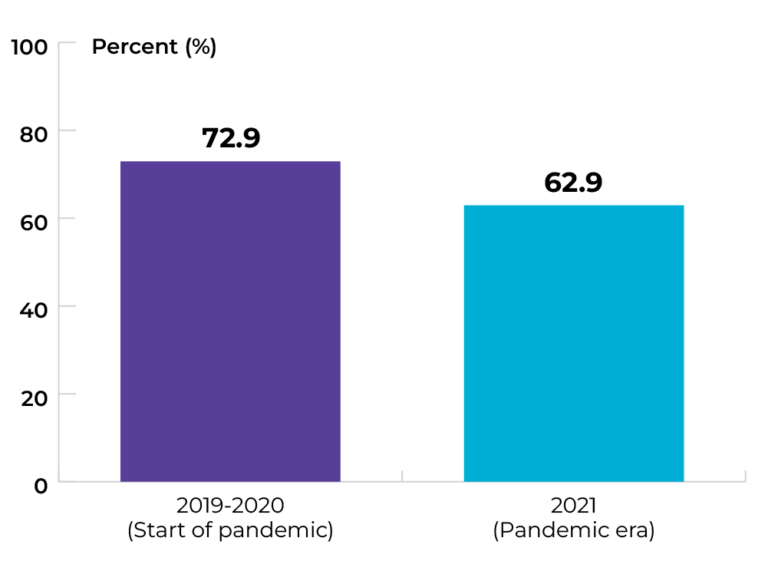
Data source: Provincial cancer agencies and programs
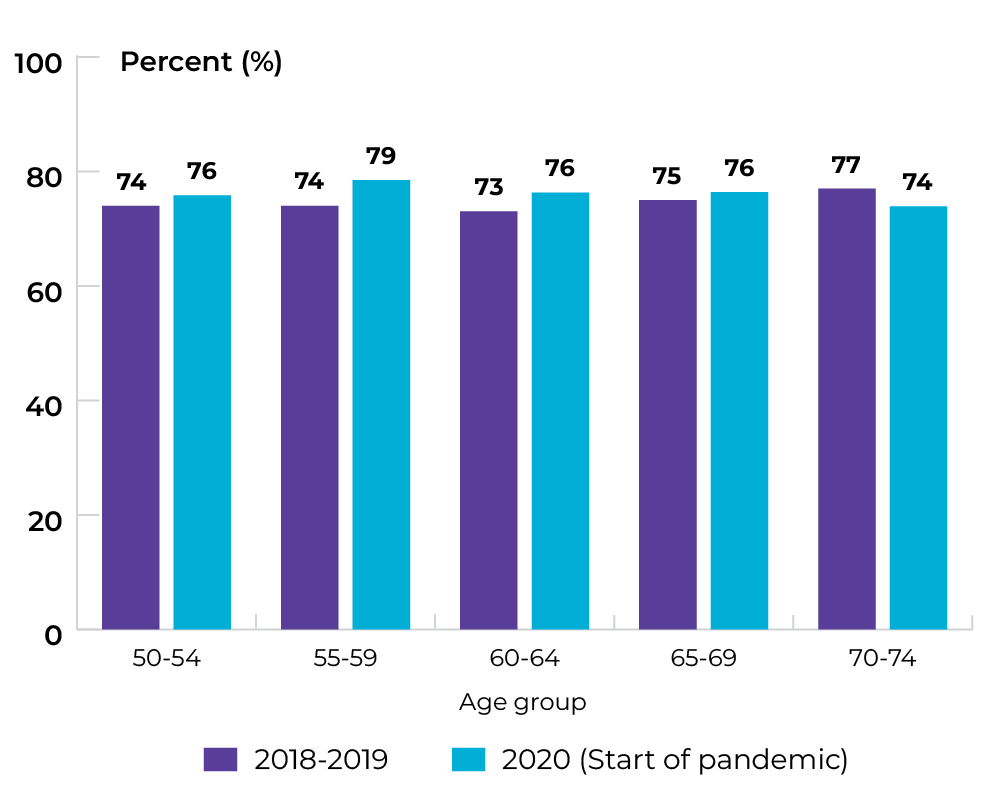
Topic: Reducing wait for diagnosis
Title of image: Percentage of colonoscopies that were completed within target (60 days after an abnormal FIT), by age group
Caveats/limitations: The COVID-19 pandemic may have affected service provision.
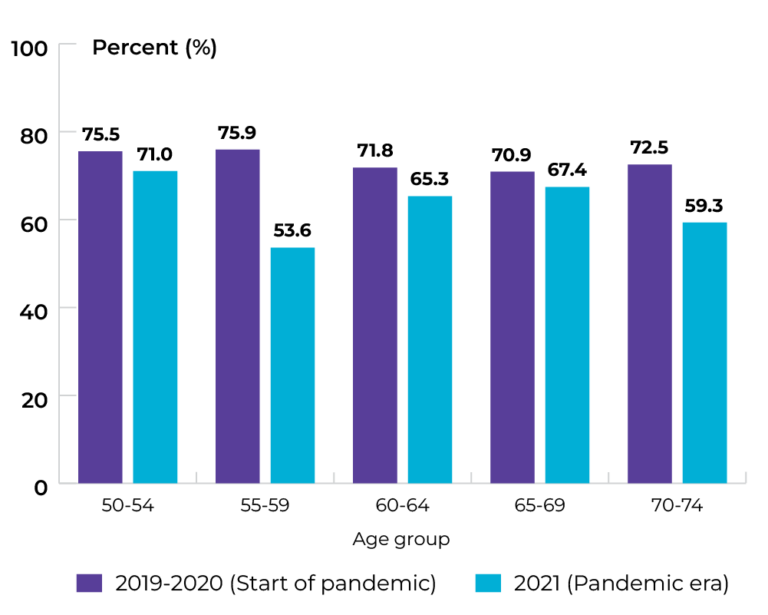
Data source: Provincial cancer agencies and programs
Topic: Reducing wait for diagnosis
Title of image: Percentage of women who had final resolution (within 7 weeks when biopsy was required and within 5 weeks when biopsy was not required) after an abnormal breast screening
Caveats/limitations: The COVID-19 pandemic may have affected service provision.
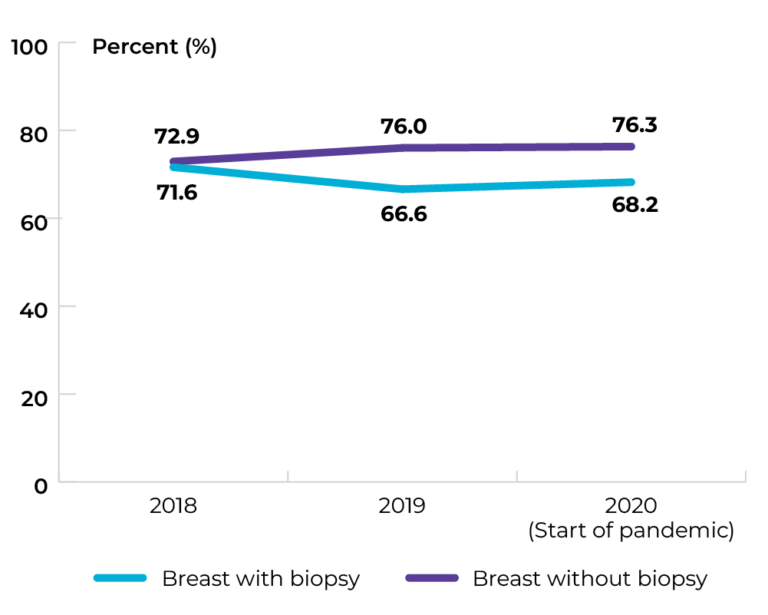
Data source: Provincial cancer agencies and programs
Topic: Reducing wait for diagnosis
Title of image: Percentage of women who had final resolution within 7 weeks when biopsy was required after an abnormal breast cancer screening test result
Caveats/limitations: The COVID-19 pandemic may have affected service provision.
Data source: Provincial cancer agencies and programs
Topic: Reducing wait for diagnosis
Title of image: Percentage of women who had final resolution within 5 weeks when biopsy was not required after an abnormal breast cancer screening test result
Caveats/limitations: The COVID-19 pandemic may have affected service provision.
Data source: Provincial cancer agencies and programs
Topic: Reducing wait for diagnosis
Title of image: Percentage of individuals who had a positive follow-up colonoscopy procedure and diagnosed with colon cancer
Caveats/limitations: The COVID-19 pandemic may have affected service provision.
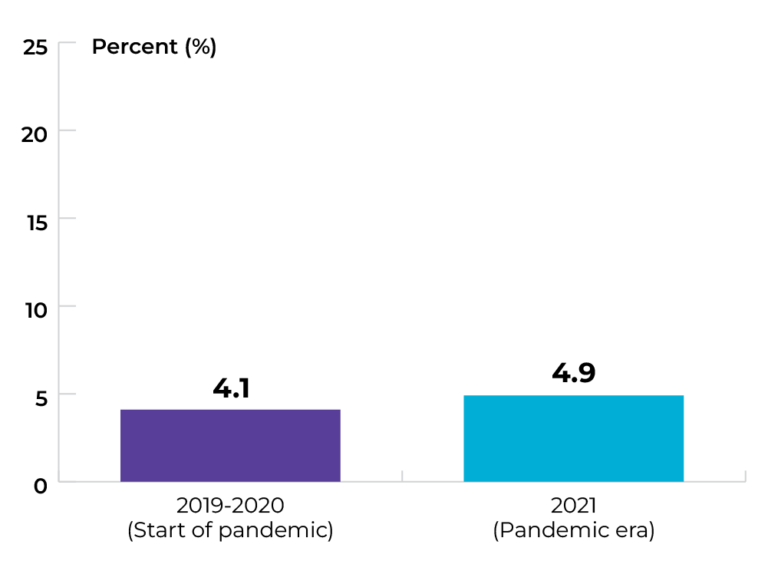
Data source: Provincial cancer agencies and programs
Topic: Reducing wait for diagnosis
Title of image: Percentage of individuals who had a positive follow-up colonoscopy procedure and diagnosed with colon cancer, by sex
Caveats/limitations: The COVID-19 pandemic may have affected service provision.
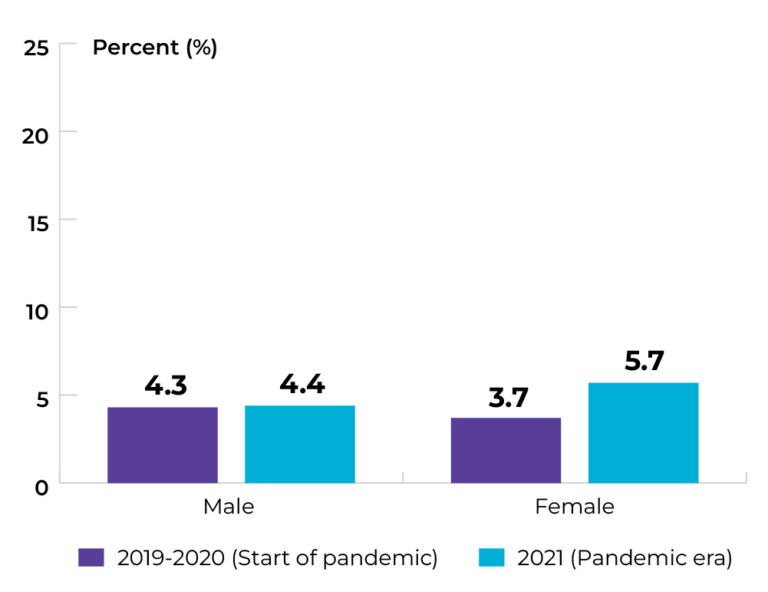 Data source: Provincial cancer agencies and programs
Topic: Reducing wait for diagnosis
Title of image: Percentage of individuals who had a positive follow-up colonoscopy procedure and diagnosed with colon cancer, by age group
Caveats/limitations: The COVID-19 pandemic may have affected service provision.
Data source: Provincial cancer agencies and programs
Topic: Diagnosing cancer earlier
Title of image: Proportion of stage 4 at diagnosis for lung and colorectal cancer
Caveats/limitations: The COVID-19 pandemic may have affected service provision.
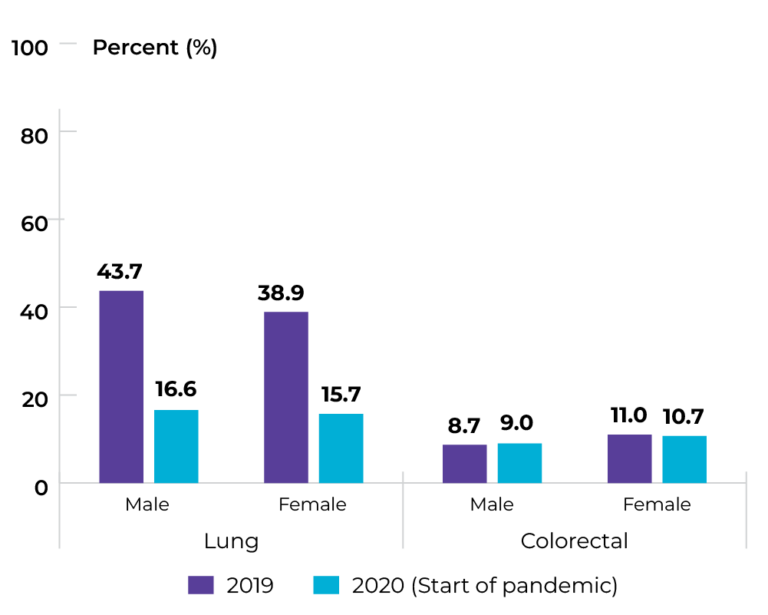
Data source: Provincial cancer agencies and programs
Topic: Diagnosing cancer earlier
Title of image: Proportion of stage at diagnosis for lung
Caveats/limitations: The COVID-19 pandemic may have affected service provision.
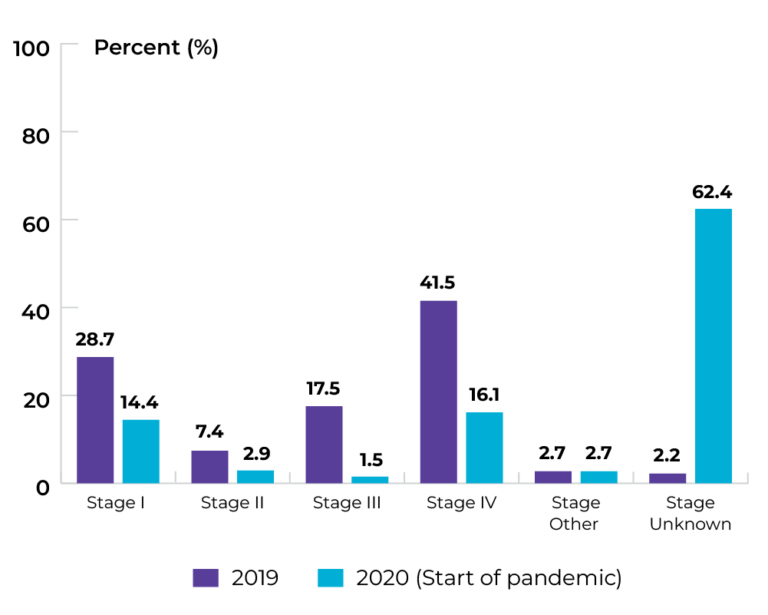
Data source: Provincial cancer agencies and programs
Topic: Diagnosing cancer earlier
Title of image: Proportion of stage at diagnosis for colorectal cancer
Caveats/limitations: The COVID-19 pandemic may have affected service provision.
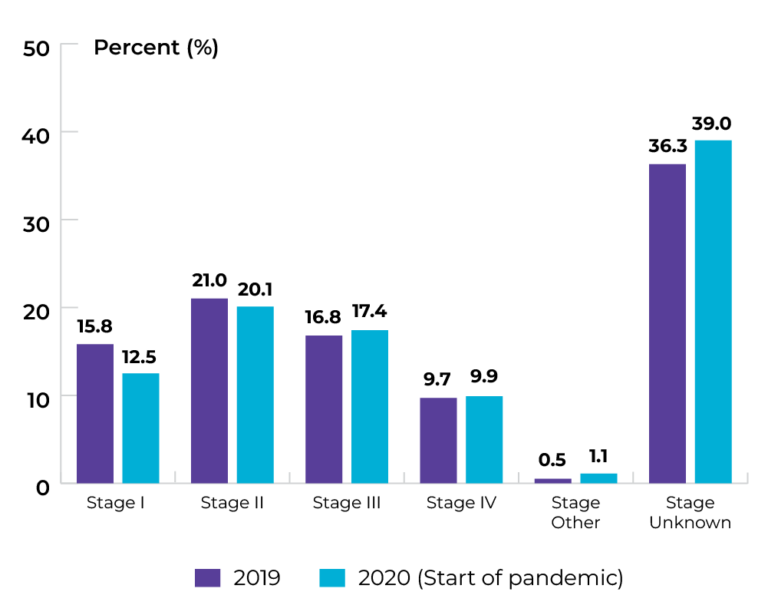
Data source: Provincial cancer agencies and programs
Priority 2 Action 2: Strengthen existing screening efforts and implement lung cancer screening programs across the country
Topic: Increasing participation in colorectal cancer screening
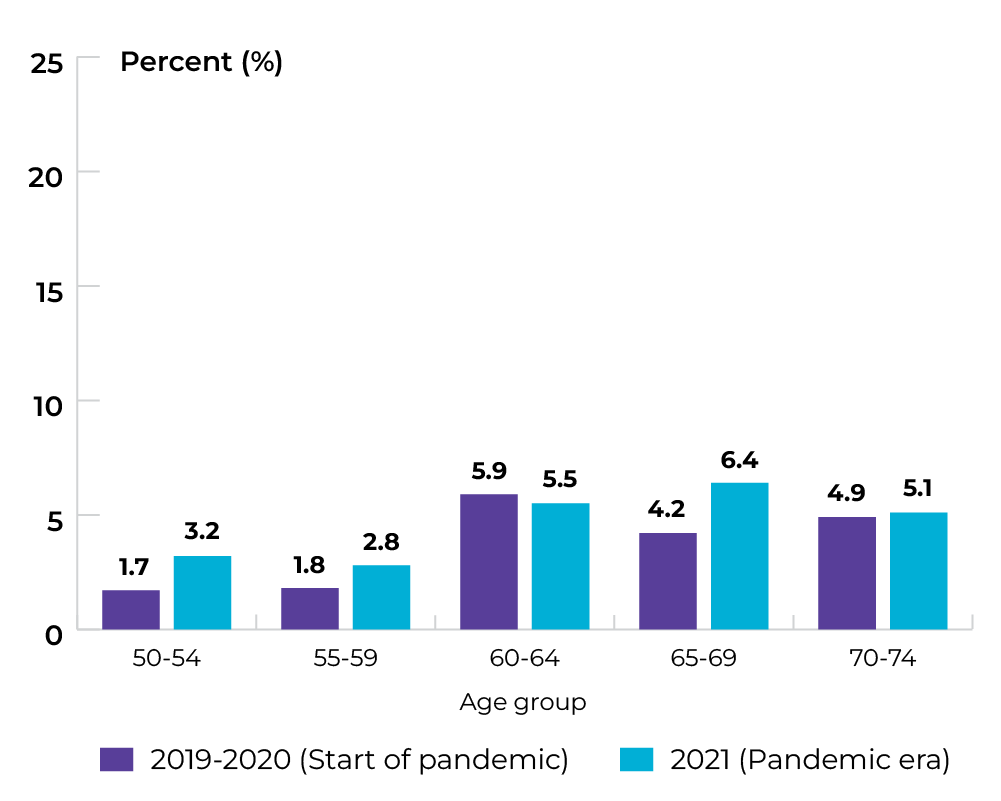
Title of image: Percentage of individuals in NB who successfully completed one FIT in the program within a 30-month period (24-month screening cycle plus 6 months grace period), by age group
Caveats/limitations: The COVID-19 pandemic may have affected service provision.
Data source: Provincial cancer agencies and programs
Priority 3 Action 1: Set best practices and standards for care delivery and promote their adoption
Topic: Implementing multidisciplinary care
Title of image: Percentage of patients diagnosed with stage II or III rectal cancer who received pre-operative radiation therapy
Caveats/limitations: The COVID-19 pandemic may have affected service provision.
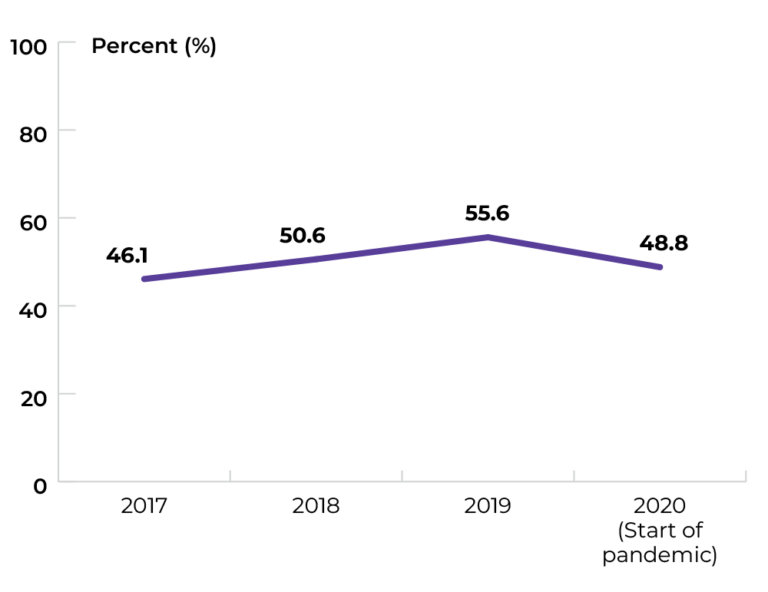 Data source: Provincial cancer agencies and programs
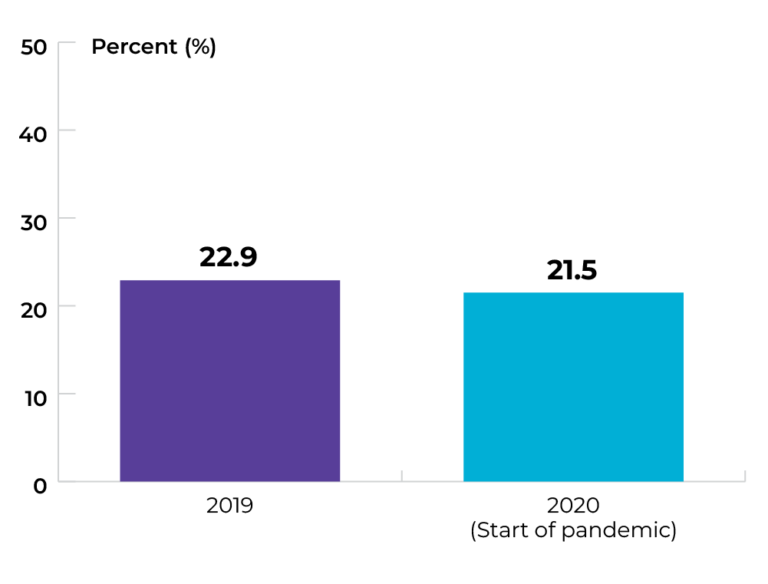
Priority 3 Action 2: Eliminate low-benefit practices and adopt high-value practices
Topic: Optimizing screening and appropriate follow-up
Title of image: Percentage of individuals who had at least one pap test in a 42-month time frame (Jan 1, 2020 – Jun 30, 2023) by age group
Caveats/limitations: The COVID-19 pandemic may have affected service provision.
Data source: Provincial cancer agencies and programs
Priority 3 Action 3: Design and implement new models of care
Topic: Expanding models of care
Title of image: Percentage of patients admitted twice or more in the last 30 days of their life to acute care hospitals with cancer diagnosis for palliative care or for whom palliative care was initiated any time during the admission
Caveats/limitations: The COVID-19 pandemic may have affected service provision.
Data source: Provincial cancer agencies and programs
Topic: Expanding models of care
Title of image: Percentage of patients admitted twice or more in the last 30 days of their life to acute care hospitals with cancer diagnosis for palliative care or for whom palliative care was initiated any time during the admission, by health region
Caveats/limitations: The COVID-19 pandemic may have affected service provision.
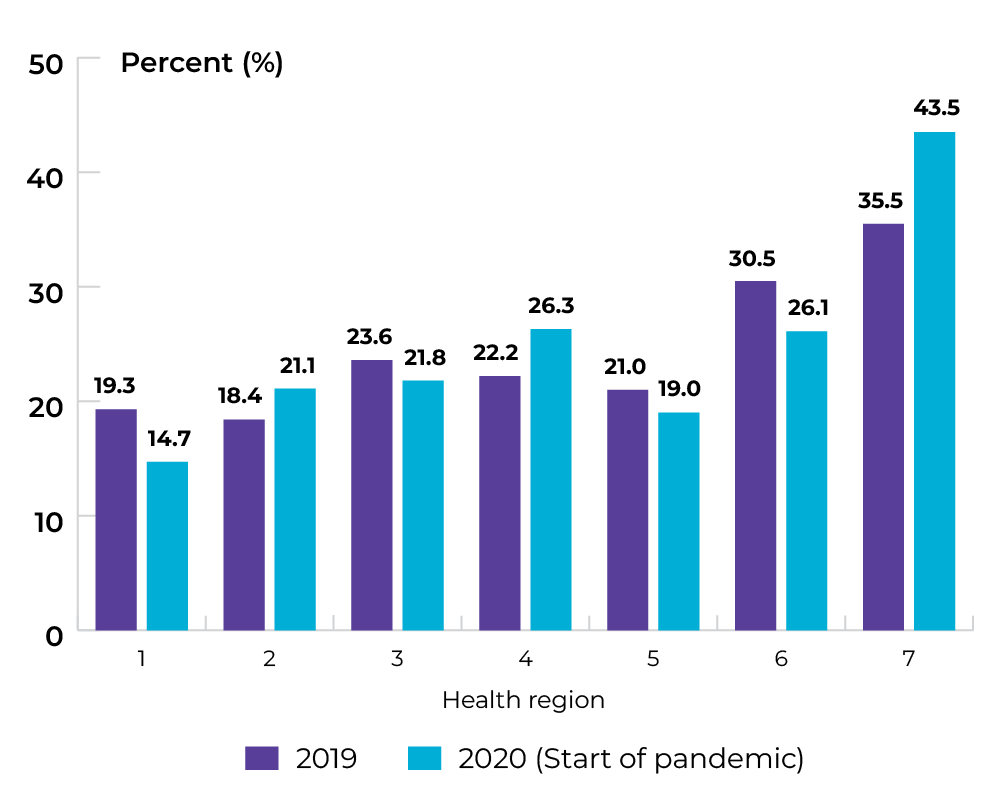
Data source: Provincial cancer agencies and programs
Topic: Expanding models of care
Title of image: Percentage of patients who died of cancer, by location of death
Caveats/limitations: The COVID-19 pandemic may have affected service provision.
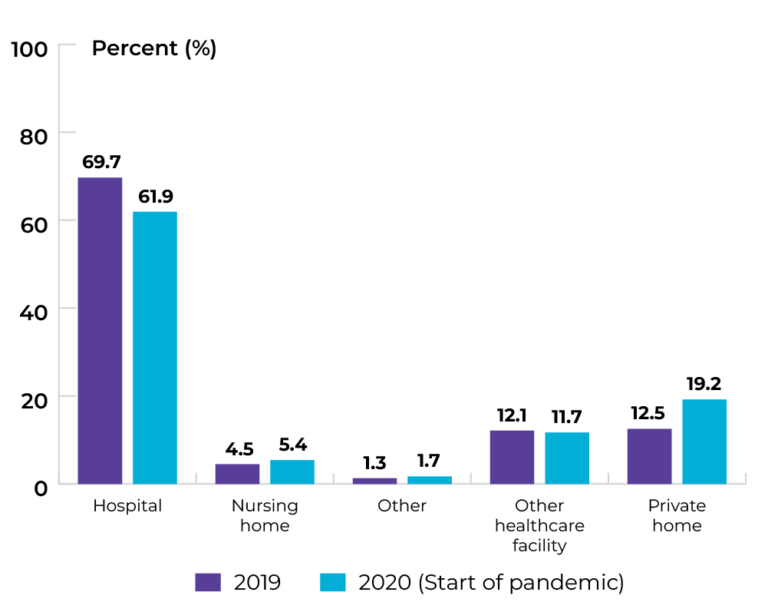
Data source: Provincial cancer agencies and programs
Topic: Expanding models of care
Title of image: Percentage of patients who died of cancer by health region
Caveats/limitations: The COVID-19 pandemic may have affected service provision.
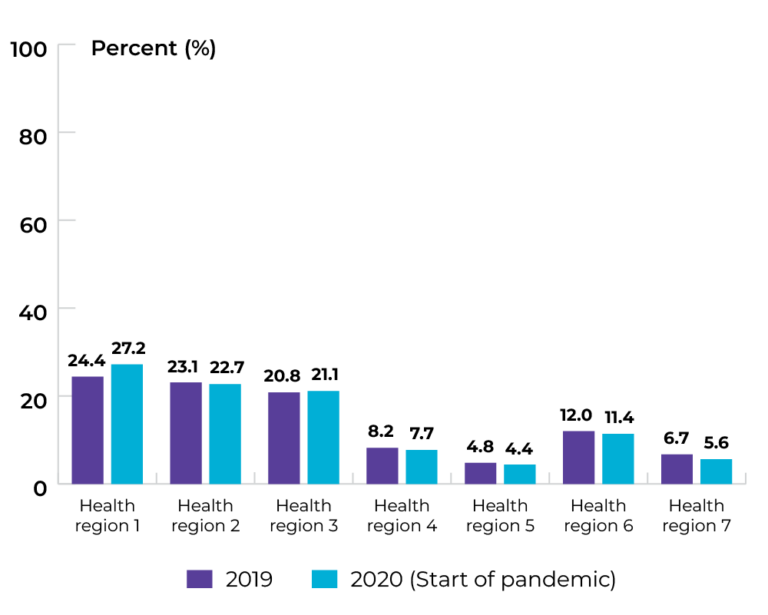
Data source: Provincial cancer agencies and programs
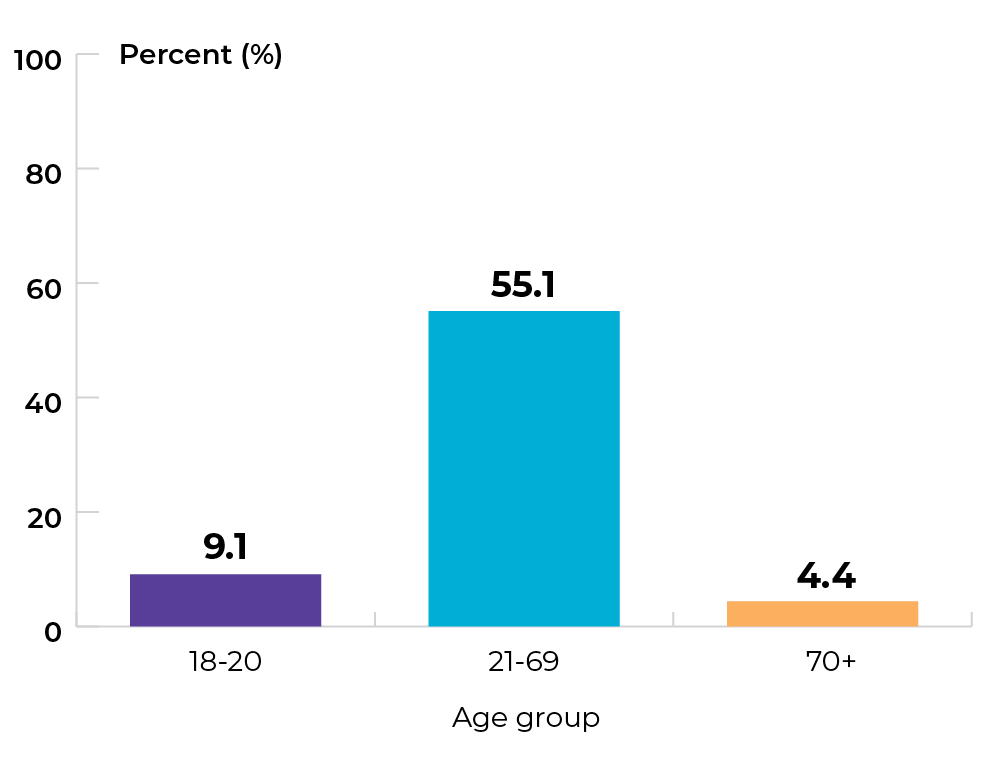
Priority 5 Action 2: Address the limited and unequal access to palliative and end-of-life care across Canada
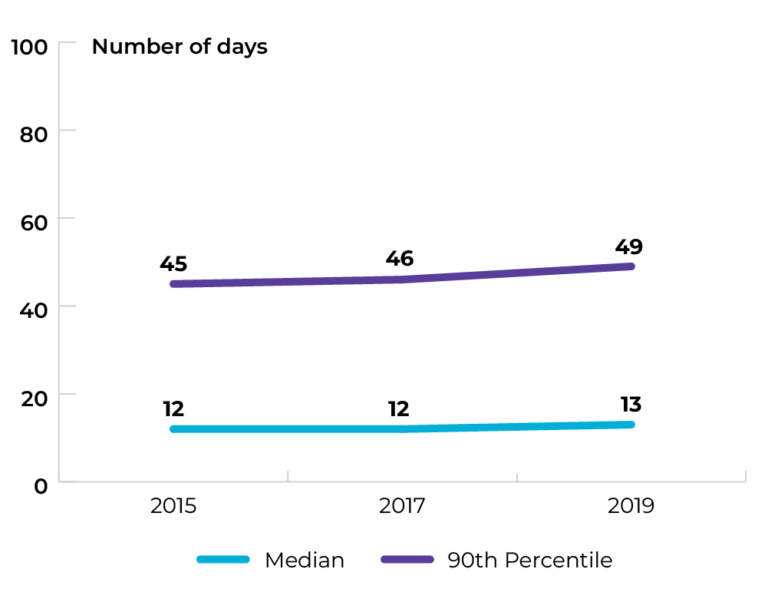
Topic: Improving access to quality end-of-life care
Title of image: Cumulative length of stay for cancer patients (overall) who were in or admitted to an acute care hospital 30 days prior to death across NB
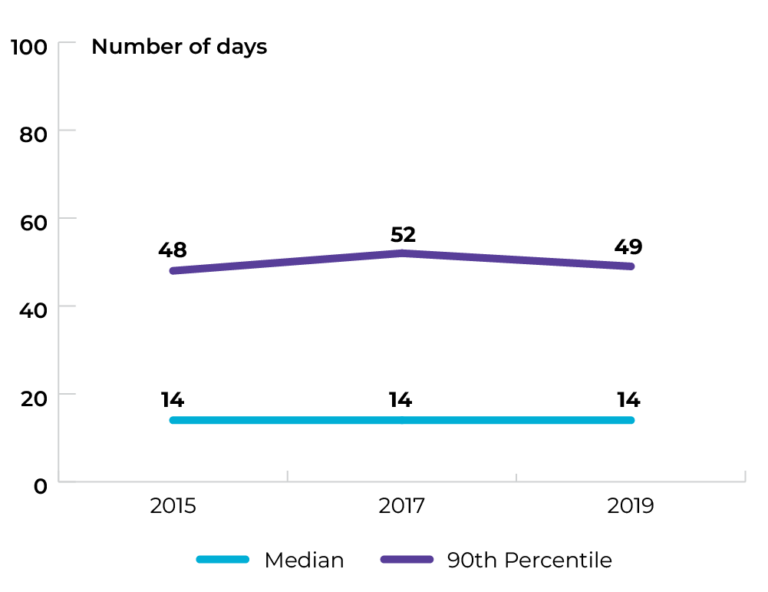
Data source: Canadian Institute for Health Information (CIHI), Discharge Abstract Database (DAD)
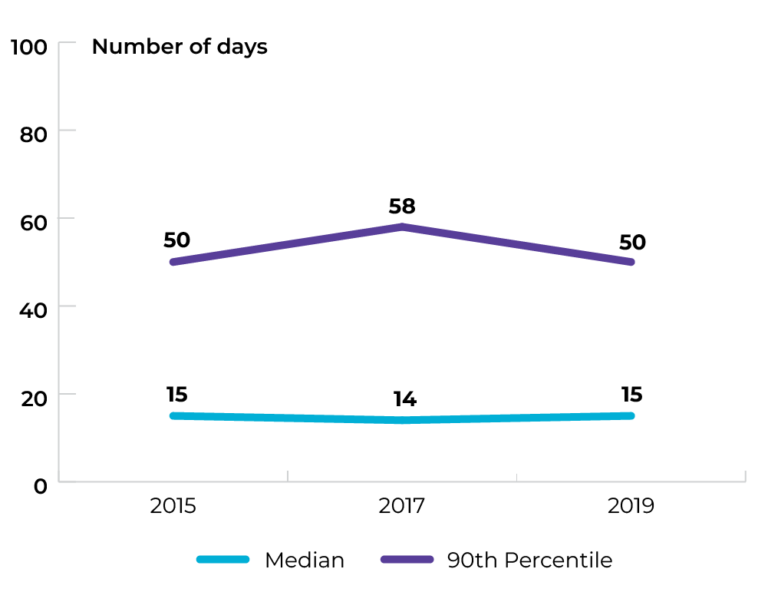
Topic: Improving access to quality end-of-life care
Title of image: Cumulative length of stay for cancer patients (rural/remote) who were in or admitted to an acute care hospital 30 days prior to death across NB
Data source: Canadian Institute for Health Information (CIHI), Discharge Abstract Database (DAD)
Topic: Improving access to quality end-of-life care
Title of image: Cumulative length of stay for cancer patients (urban) who were in or admitted to an acute care hospital 30 days prior to death across NB
Data source: Canadian Institute for Health Information (CIHI), Discharge Abstract Database (DAD)
The data tables and technical appendix for all indicators are available upon request at info@partnershipagainstcancer.ca. You will receive a response in two to three business days.