Supplementary data: Manitoba
This page provides data visualizations related to the priorities for Canada’s cancer system.
The data tables and technical appendix for all indicators are available upon request at info@partnershipagainstcancer.ca.
Priority 1 Action 1: Help people to stop smoking or not start in the first place and live healthier lives
Topic: Keeping people smoke-free
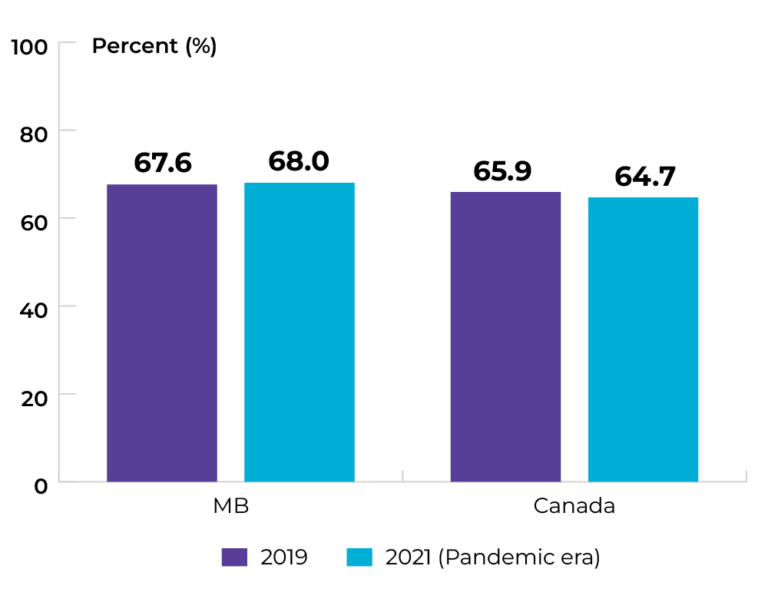
Title of image: Percentage of individuals (aged ≥ 12) classified as daily or occasional smokers
Caveats/limitations:
- This indicator was reported using the Canadian Community Health Survey (CCHS).
- Individuals who did not respond to the required CCHS questions regarding smoking status were not included in the analysis.
- The COVID-19 pandemic had major impacts on the data collection operations and response rates for this survey.
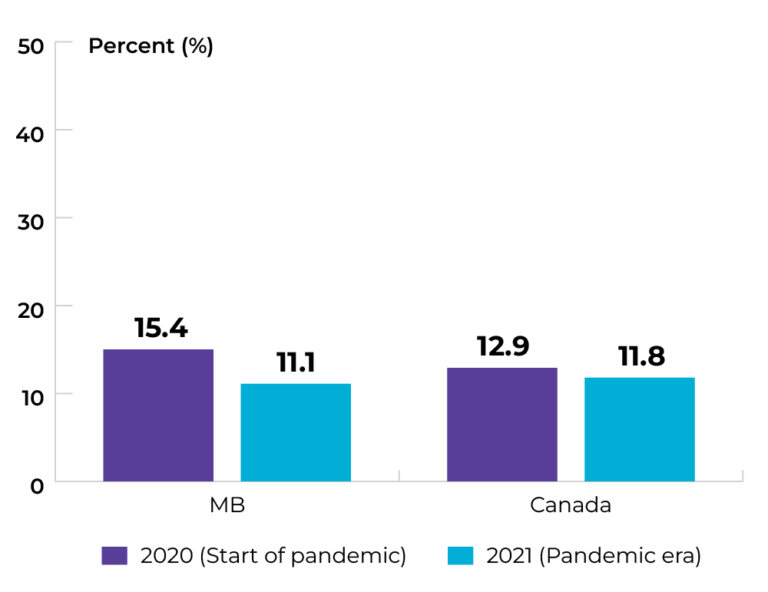
Data source: Canadian Community Health Survey
Topic: Keeping people smoke-free
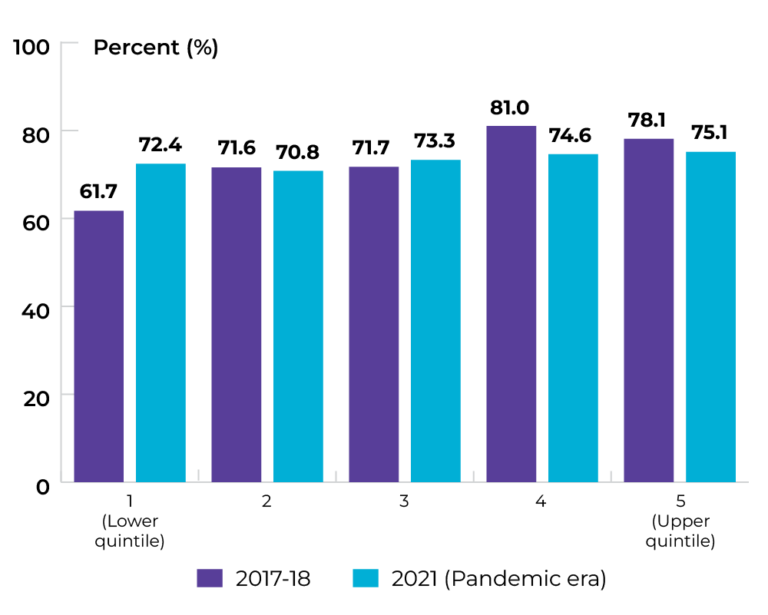
Title of image: Percentage of males (aged ≥ 18) classified as daily or occasional smokers, by household income quintile
Caveats/limitations:
- The COVID-19 pandemic had major impacts on the data collection operations and response rates for this survey.
- Interpret with caution owing to large variability in the 2021 estimates.
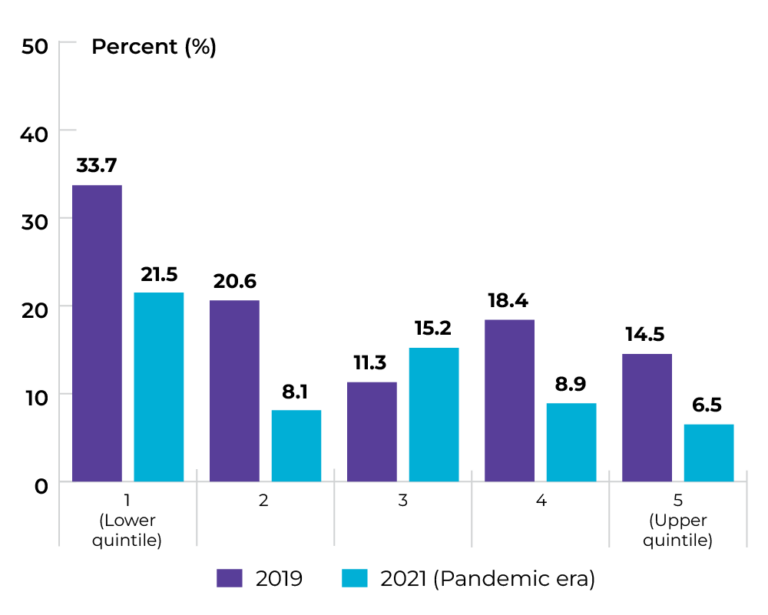
Data source: Canadian Community Health Survey
Topic: Keeping people smoke-free
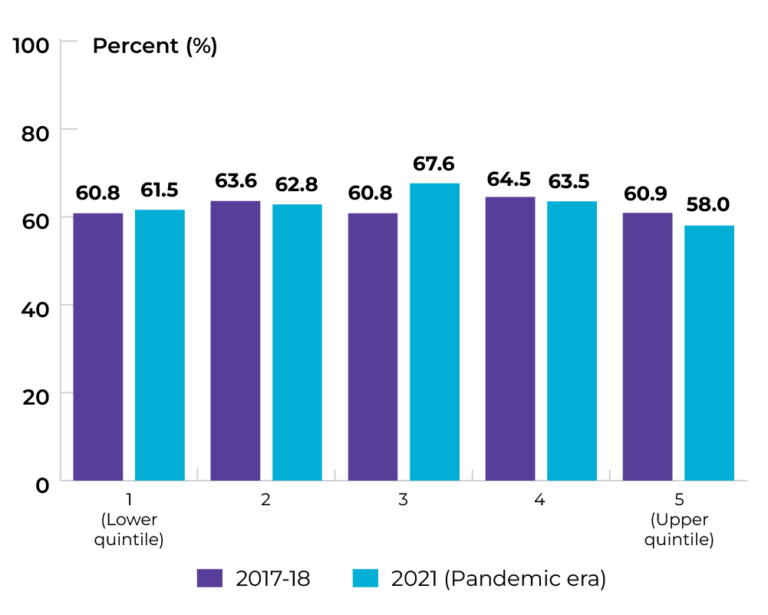
Title of image: Percentage of females (aged ≥ 18) classified as daily or occasional smokers, by household income quintile
Caveats/limitations:
- The COVID-19 pandemic had major impacts on the data collection operations and response rates for this survey.
- Interpret with caution owing to large variability in the 2021 estimates.
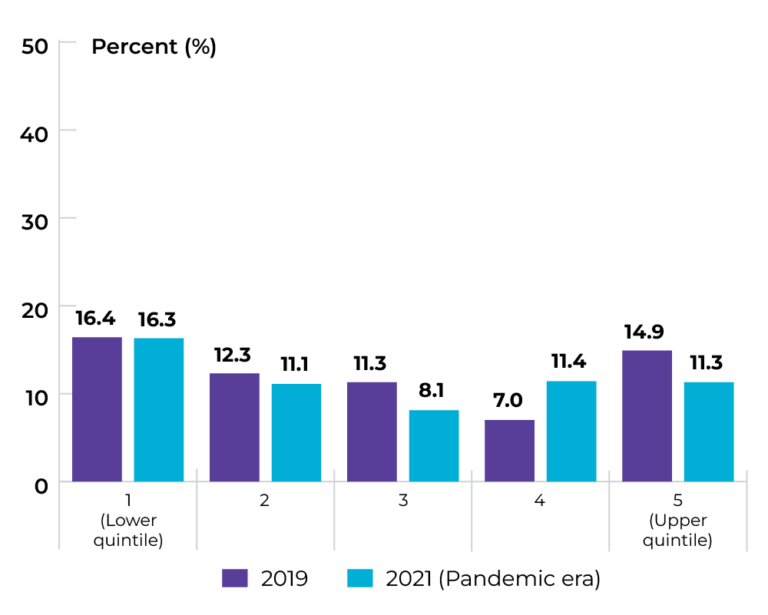
Data source: Canadian Community Health Survey
Topic: Keeping people smoke-free
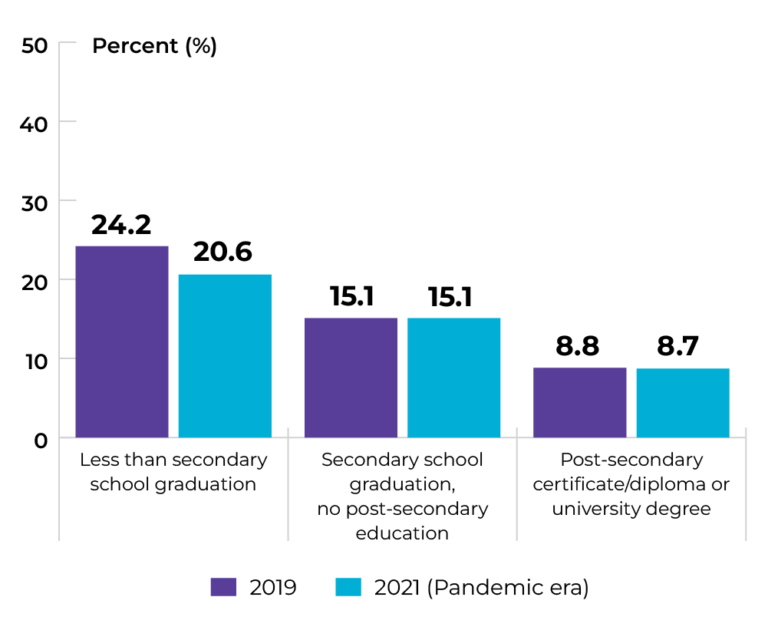
Title of image: Percentage of males (aged ≥ 18) classified as daily or occasional smokers, by education
Caveats/limitations:
- The COVID-19 pandemic had major impacts on the data collection operations and response rates for this survey.
- Interpret with caution owing to large variability in the 2021 estimates.
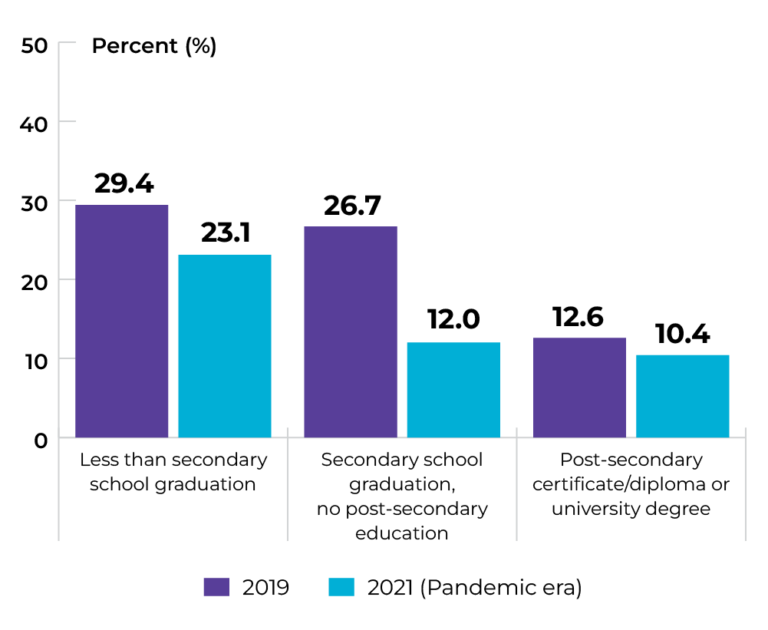 Data source: Canadian Community Health Survey
Topic: Keeping people smoke-free
Title of image: Percentage of females (aged ≥ 18) classified as daily or occasional smokers, by education
Caveats/limitations:
- The COVID-19 pandemic had major impacts on the data collection operations and response rates for this survey.
- Interpret with caution owing to large variability in the 2021 estimates.
Data source: Canadian Community Health Survey
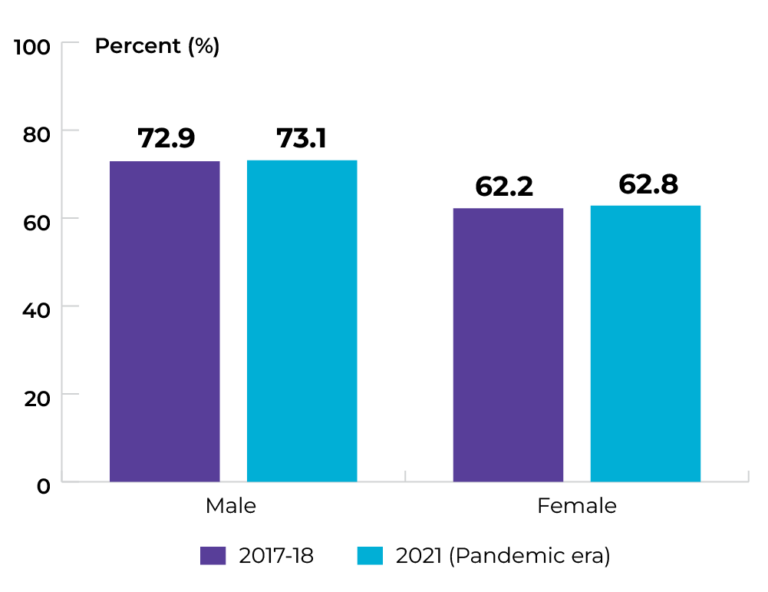
Topic: Maintaining healthy body weight
Title of image: Percentage of individuals (aged ≥ 18) classified as overweight or obese
Caveats/limitations:
- This indicator was reported using the Canadian Community Health Survey (CCHS).
- Individuals who did not respond to the required CCHS questions to derive the BMI classifications were not included in the analysis.
- The COVID-19 pandemic had major impacts on the data collection operations and response rates for this survey.
Data source: Canadian Community Health Survey
Topic: Maintaining healthy body weight
Title of image: Percentage of males (aged ≥ 18) classified as overweight or obese, by income quintile
Caveats/limitations: The COVID-19 pandemic had major impacts on the data collection operations and response rates for this survey.
Data source: Provincial cancer agencies and programs
Topic: Maintaining healthy body weight
Title of image: Percentage of females (aged ≥ 18) classified as overweight or obese, by income quintile
Caveats/limitations: The COVID-19 pandemic had major impacts on the data collection operations and response rates for this survey.
 Data source: Provincial cancer agencies and programs
Topic: Maintaining healthy body weight
Title of image: Percentage of individuals (aged ≥ 18) classified as overweight or obese, by sex
Caveats/limitations: The COVID-19 pandemic had major impacts on the data collection operations and response rates for this survey.
Data source: Canadian Community Health Survey
Priority 1 Action 2: Adopt proven practices known to reduce the risk of cancer
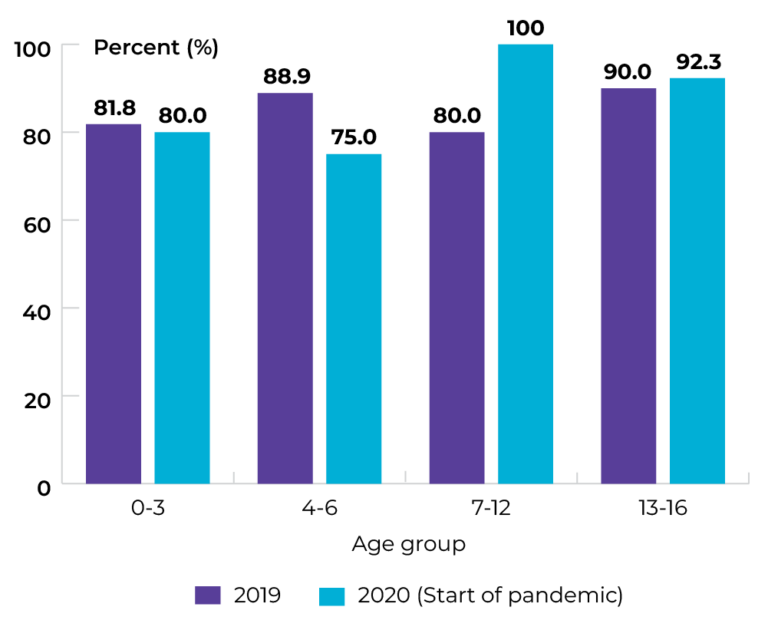
Topic: Increasing HPV vaccination
Title of image: Percentage of individuals who received a full course of HPV vaccination by age 13 through Manitoba’s routine immunization program, by sex
Caveats/limitations: The COVID-19 pandemic may have affected service provision.
Data source: Provincial cancer agencies and programs
Topic: Increasing HPV vaccination
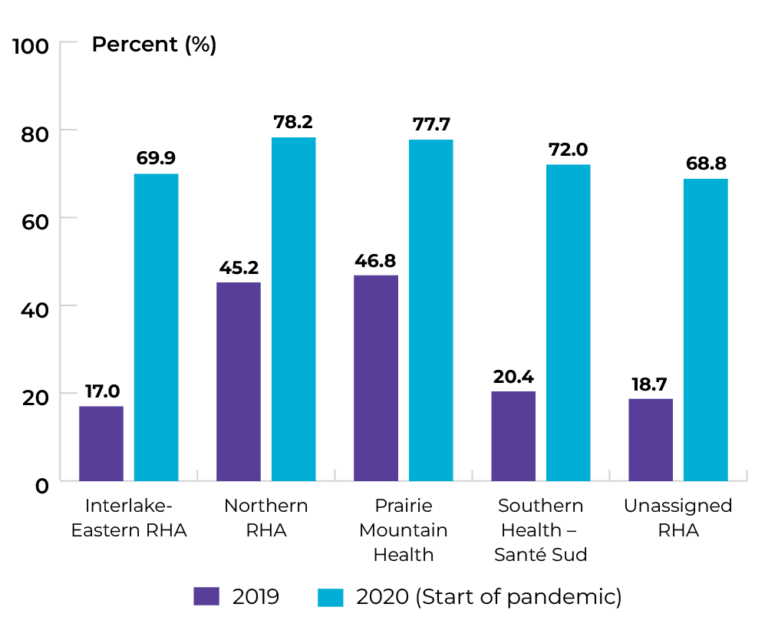
Title of image: Percentage of males who received a full course of HPV vaccination by age 13 through Manitoba’s routine immunization program, by Regional Health Authority
Caveats/limitations: The COVID-19 pandemic may have affected service provision.

Data source: Provincial cancer agencies and programs
Topic: Increasing HPV vaccination
Title of image: Percentage of females who received a full course of HPV vaccination by age 13 through Manitoba’s routine immunization program, by Regional Health Authority
Caveats/limitations: The COVID-19 pandemic may have affected service provision.

Data source: Provincial cancer agencies and programs
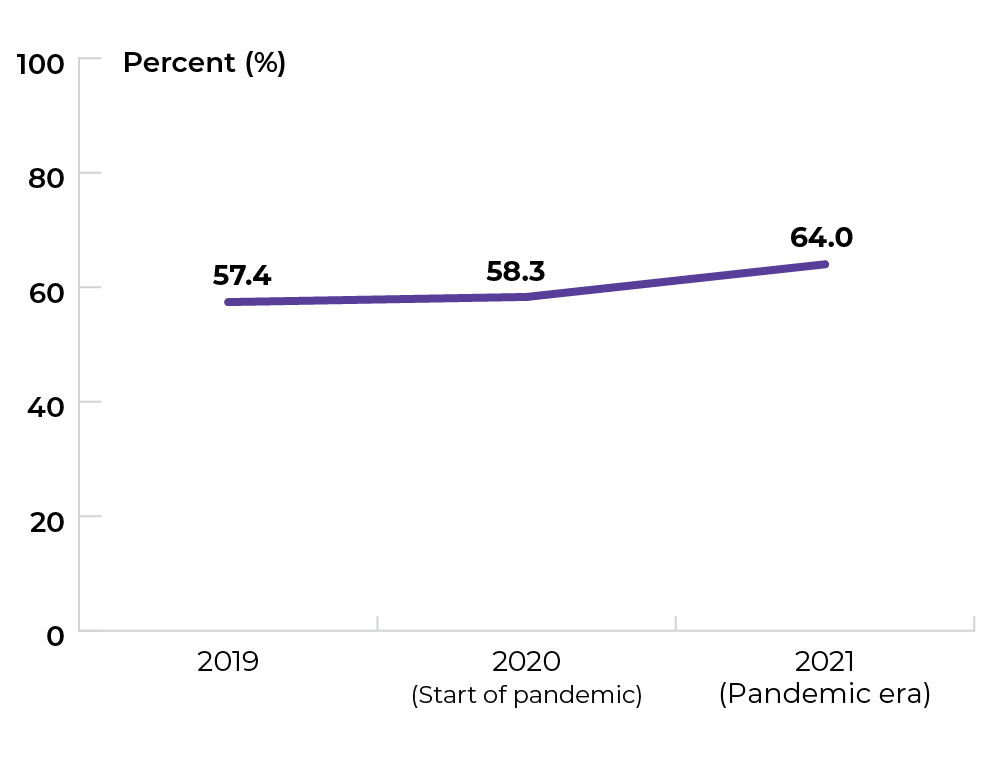
Topic: Increasing HPV vaccination
Title of image: Percentage of females who received a full course of HPV vaccination by age 17 through Manitoba’s routine immunization program
Caveats/limitations: The COVID-19 pandemic may have affected service provision.

Data source: Provincial cancer agencies and programs
Topic: Increasing HPV vaccination
Title of image: Percentage of females who received a full course of HPV vaccination by age 17 through Manitoba’s routine immunization program, by Regional Health Authority
Caveats/limitations: The COVID-19 pandemic may have affected service provision.

Data source: Provincial cancer agencies and programs
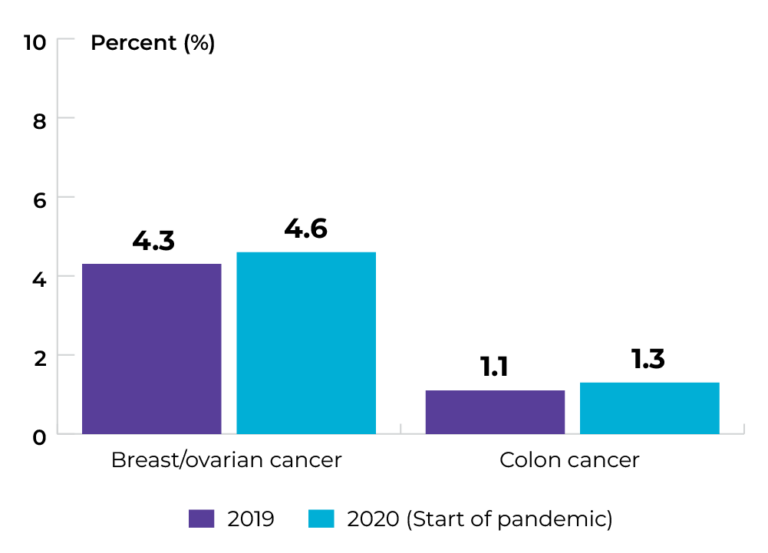
Topic: Increasing genetic testing
Title of image: Percentage of breast/ovarian and colon cancer patients who were eligible and received a hereditary cancer screen (10- or 12-gene panel).
Caveats/limitations:
- The COVID-19 pandemic may have affected service provision.
- Eligibility for hereditary cancer screens include patients with no known pathogenic familial variant and who meet panel testing criteria. Individuals who do not meet this eligibility criteria include those with a familial mutation who will receive genetic testing for the mutation of interest only or those who do not meet full criteria for the 10- or 12-gene panel but may have other genetic testing panels completed (e.g., individuals meeting specific ethnic requirements for variants common in that population).
Data source: Provincial cancer agencies and programs
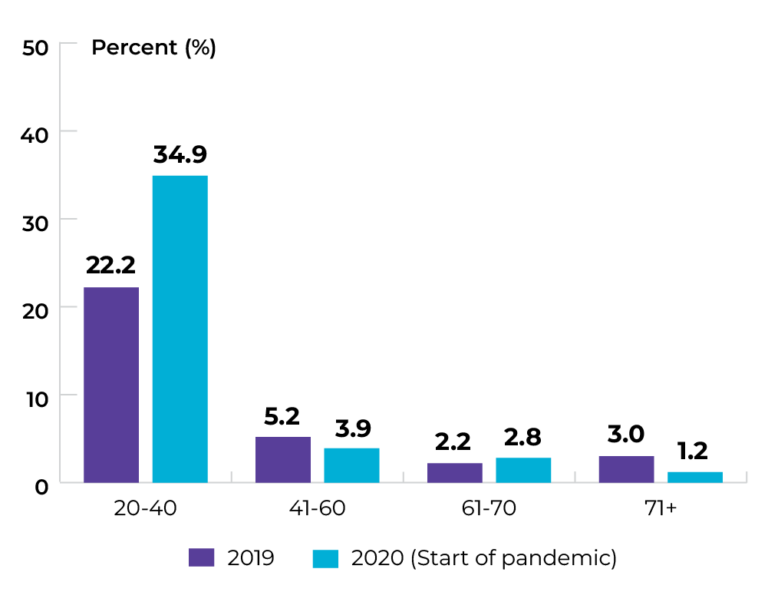
Topic: Increasing genetic testing
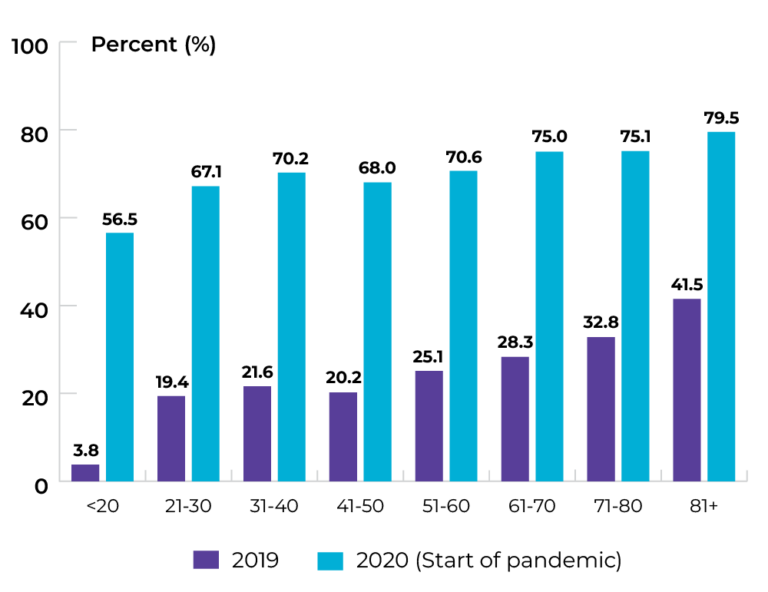
Title of image: Percentage of breast/ovarian cancer patients who were eligible and received hereditary cancer screening (10- or 12-gene panel), by age group
Caveats/limitations:
- The COVID-19 pandemic may have affected service provision.
- Eligibility for hereditary cancer screens include patients with no known pathogenic familial variant and who meet panel testing criteria. Individuals who do not meet this eligibility criteria include those with a familial mutation who will receive genetic testing for the mutation of interest only or those who do not meet full criteria for the 10- or 12-gene panel but may have other genetic testing panels completed (e.g., individuals meeting specific ethnic requirements for variants common in that population).
Data source: Provincial cancer agencies and programs
Topic: Increasing genetic testing
Title of image: Percentage of colorectal cancer patients diagnosed within a two-year period who had a completed tumour tissue screen for Lynch Syndrome (MMR testing)
Caveats/limitations: The COVID-19 pandemic may have affected service provision.
Data source: Provincial cancer agencies and programs
Topic: Increasing genetic testing
Title of image: Percentage of colorectal cancer patients diagnosed within a two-year period who had a completed tumour tissue screen for Lynch Syndrome (MMR testing) , by age group
Caveats/limitations: The COVID-19 pandemic may have affected service provision.
Data source: Provincial cancer agencies and programs
Topic: Increasing genetic testing
Title of image: Percentage of colorectal cancer patients diagnosed within a two-year period who had a completed tumour tissue screen for Lynch Syndrome (MMR testing) , by sex
Caveats/limitations: The COVID-19 pandemic may have affected service provision.
Data source: Provincial cancer agencies and programs
Priority 2 Action 1: Prioritize rapid access to appropriate diagnosis for those suspected of having cancer
Topic: Reducing wait for diagnosis
Title of image: Wait time from date of an abnormal CancerCare Manitoba BreastCheck screening result to date of final diagnosis when tissue biopsy is and is not required in females aged 50-74 in 2019-20.
Caveats/limitations: The COVID-19 pandemic may have affected service provision.
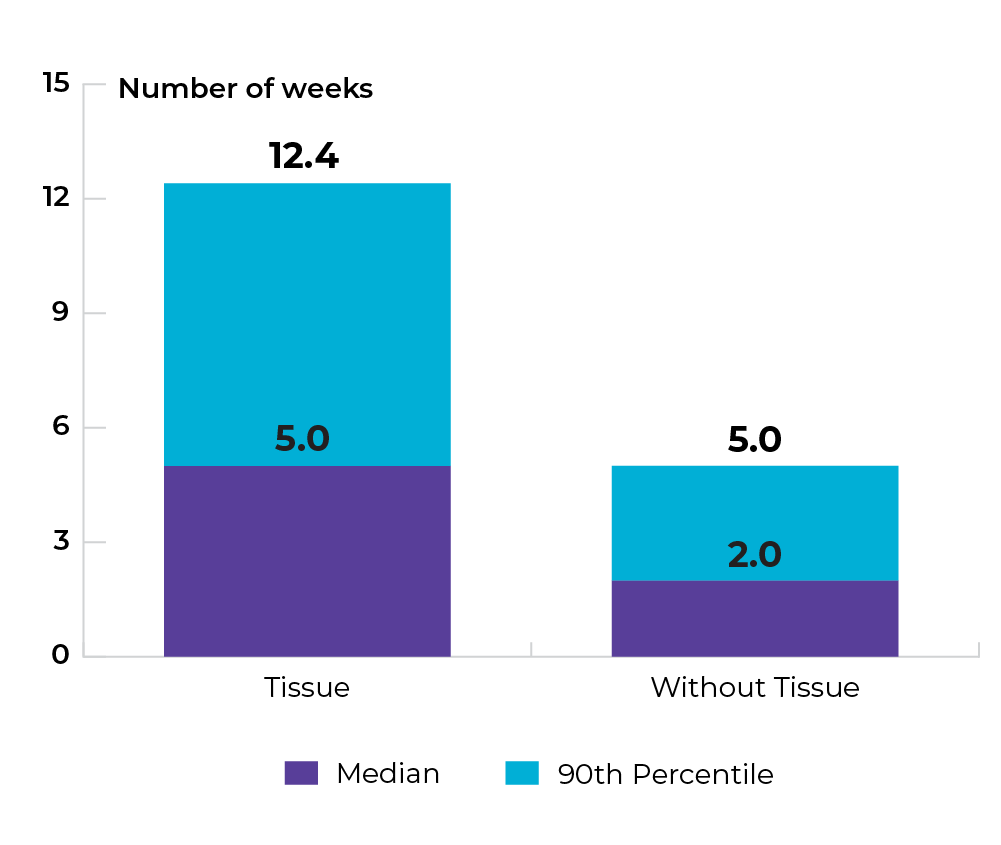
Data source: Provincial cancer agencies and programs
Topic: Reducing wait for diagnosis
Title of image: Wait time from the date of an abnormal BreastCheck screening mammogram result to the date of final diagnosis with tissue biopsy for females aged 50-74 in 2019-20, by Regional Health Authority
Caveats/limitations: The COVID-19 pandemic may have affected service provision.

Data source: Provincial cancer agencies and programs
Topic: Reducing wait for diagnosis
Title of image: Wait time from the date of an abnormal CancerCare Manitoba BreastCheck screening mammogram result to the date of final diagnosis without tissue biopsy for females aged 50-74 in 2019-20, by Regional Health Authority
Caveats/limitations: The COVID-19 pandemic may have affected service provision.

Data source: Provincial cancer agencies and programs
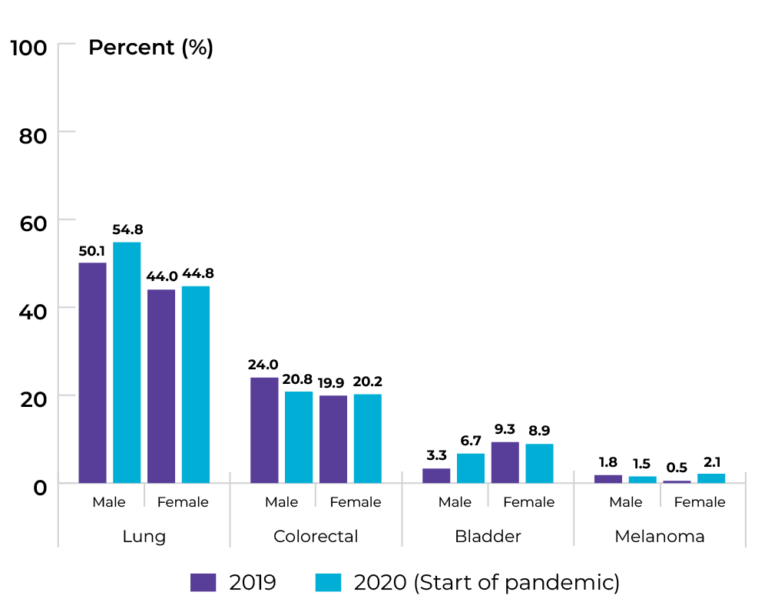
Topic: Diagnosing cancer earlier
Title of image: Proportion of late-stage diagnoses (stage IV) for lung, colorectal, bladder, and melanoma cancers, by sex
Caveats/limitations:
- Duplicate/multiple instances of the same patient have been removed if they occur within the same cancer site.
- If the same patient has more than one cancer across the four sites (lung, melanoma, bladder or colorectal), they were not removed.
- The COVID-19 pandemic may have affected service provision.
Data source: Provincial cancer agencies and programs
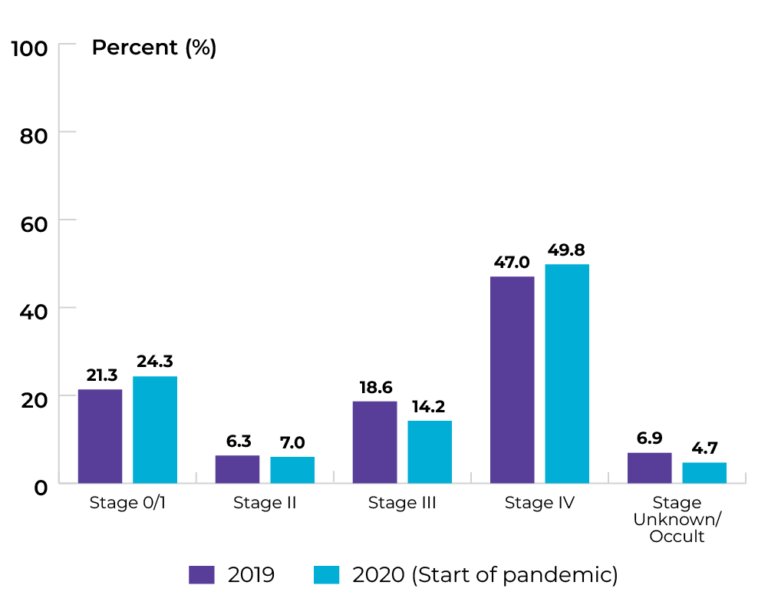
Topic: Diagnosing cancer earlier
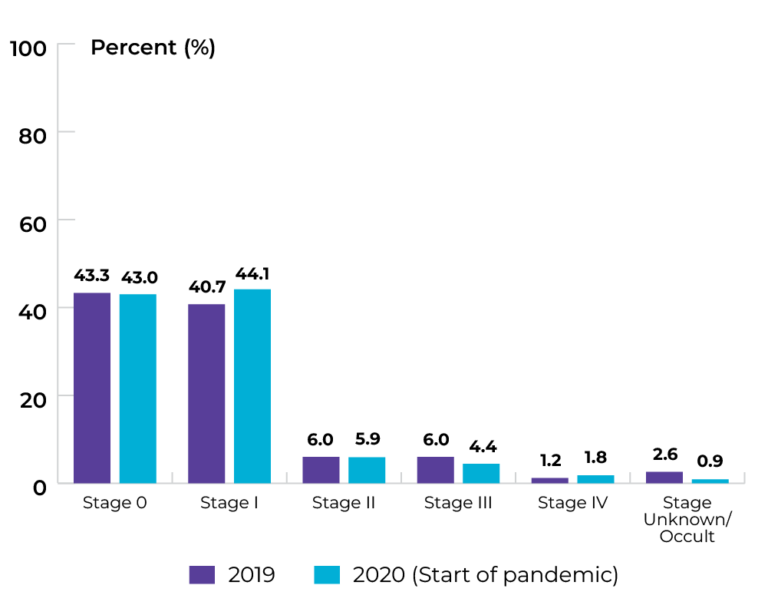
Title of image: Stage distribution at time of lung cancer diagnosis
Caveats/limitations: The COVID-19 pandemic may have affected service provision.
 Data source: Provincial cancer agencies and programs
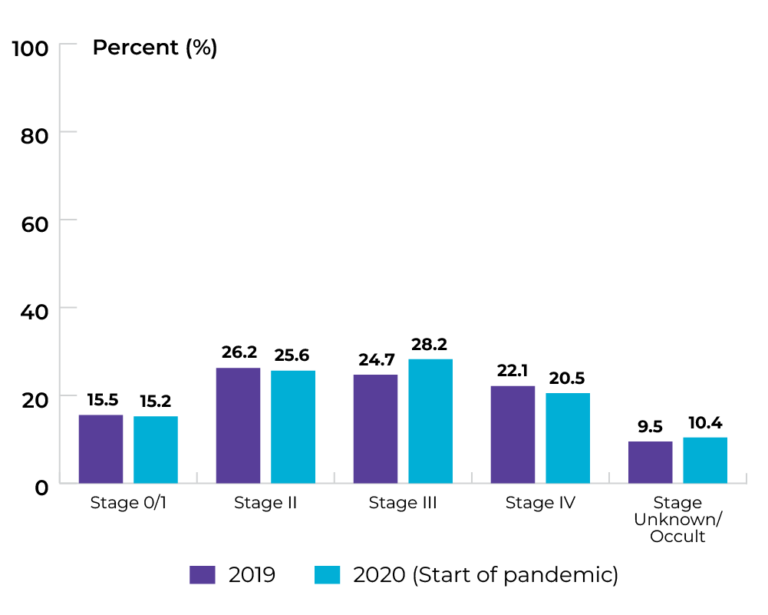
Topic: Diagnosing cancer earlier
Title of image: Stage distribution at time of colorectal cancer diagnosis
Caveats/limitations: The COVID-19 pandemic may have affected service provision.
Data source: Provincial cancer agencies and programs
Topic: Diagnosing cancer earlier
Title of image: Stage distribution at time of bladder cancer diagnosis
Caveats/limitations: The COVID-19 pandemic may have affected service provision.
 Data source: Provincial cancer agencies and programs
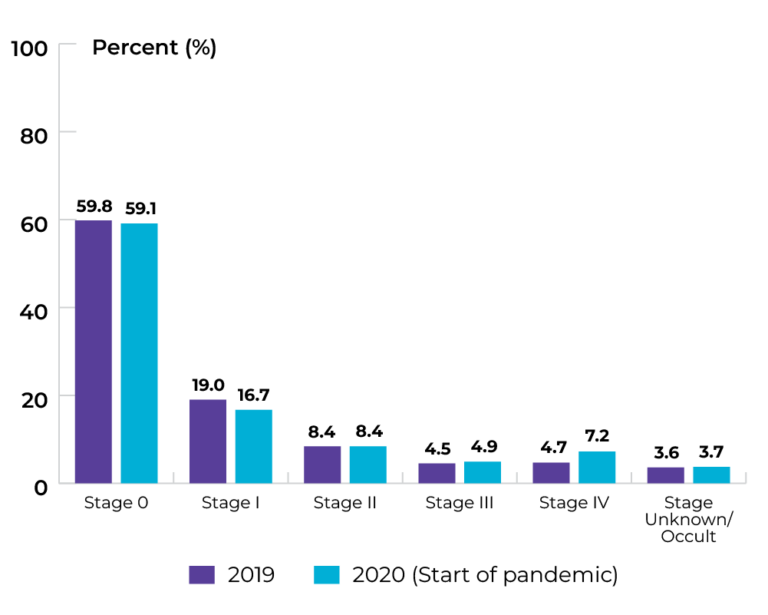
Topic: Diagnosing cancer earlier
Title of image: Stage distribution at time of melanoma (skin cancer) diagnosis
Caveats/limitations: The COVID-19 pandemic may have affected service provision.
Data source: Provincial cancer agencies and programs
Priority 2 Action 2: Strengthen existing screening efforts and implement lung cancer screening programs across the country
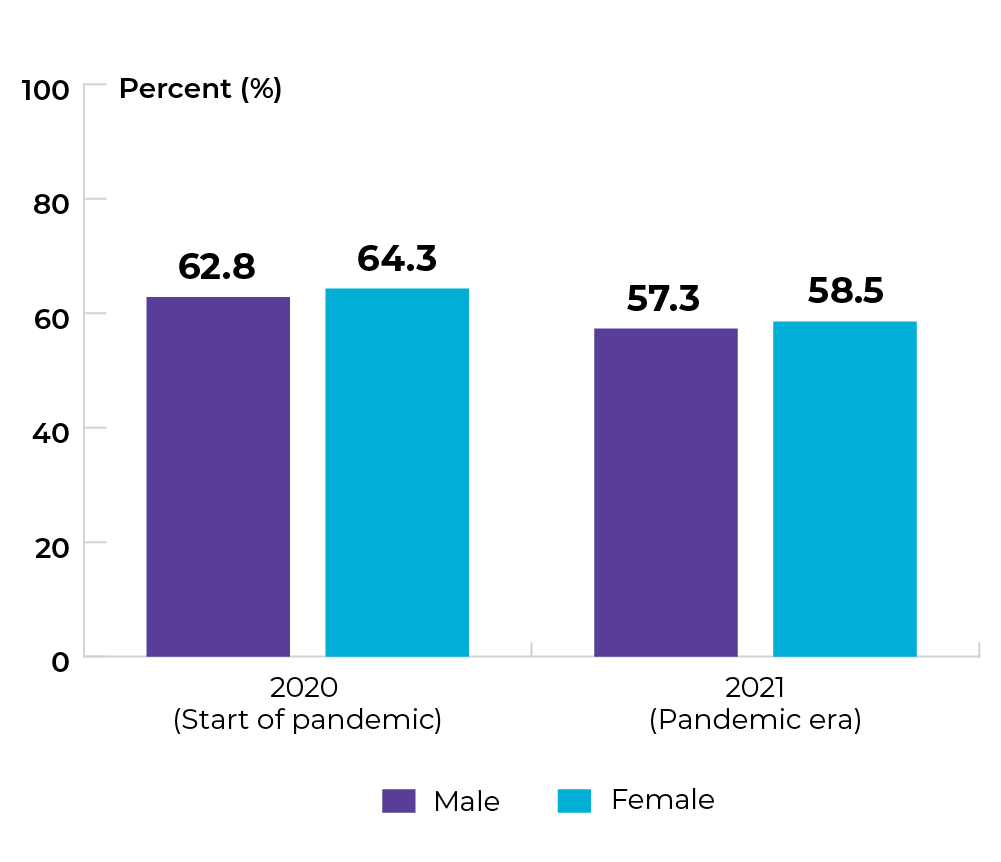
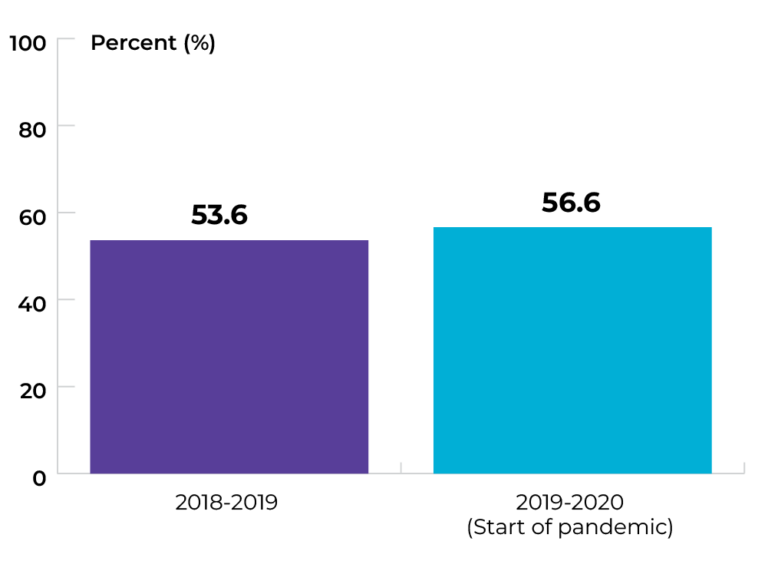
Topic: Increasing participation in colorectal cancer screening
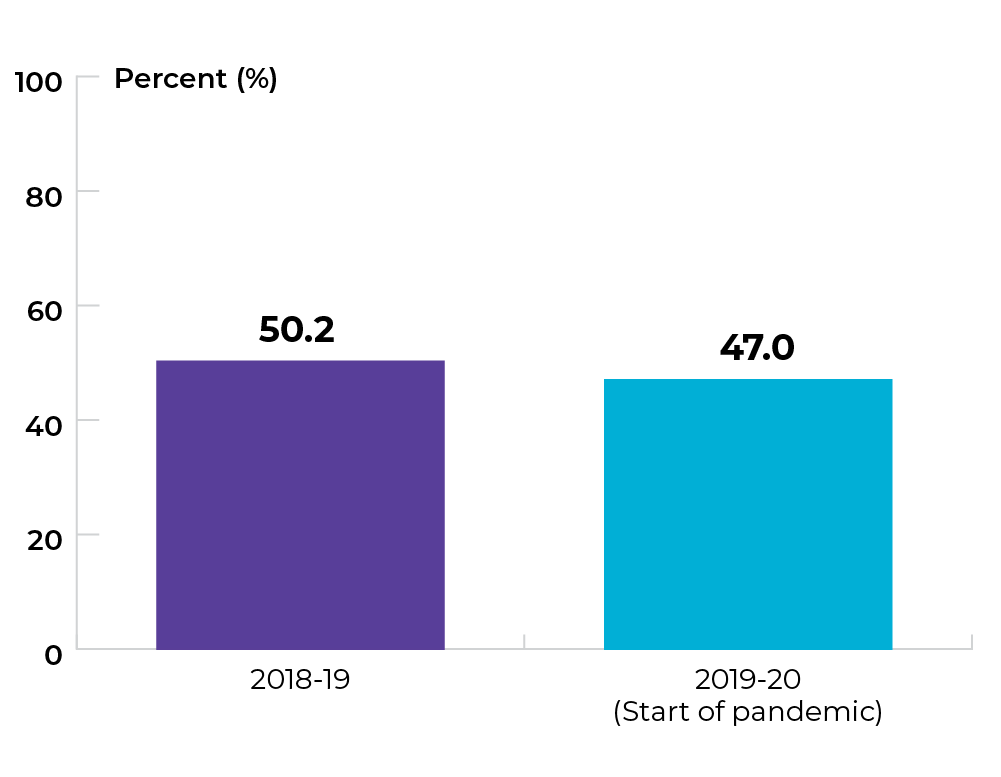
Title of image: Percentage of individuals aged 50-74 who are up to date on colon cancer screening.
Caveats/limitations:
- Up to date for screening describes individuals 50-74 years of age who have completed a fecal test in the past two years and/or colonoscopy/sigmoidoscopy in the last five years.
- The COVID-19 pandemic may have affected service provision.
Data source: Provincial cancer agencies and programs
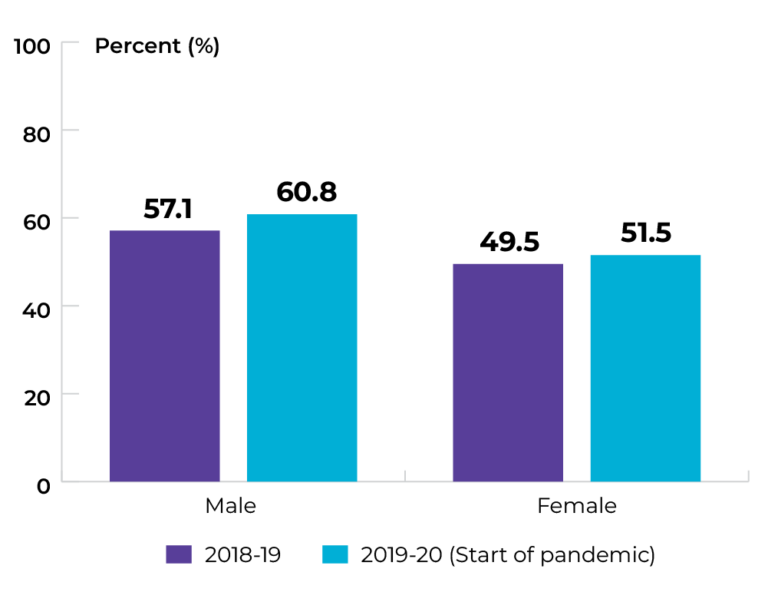
Topic: Increasing participation in colorectal cancer screening
Title of image: Percentage of individuals aged 50-74 who are up to date on colon cancer screening, by sex
Caveats/limitations:
- Up to date for screening describes individuals 50-74 years of age who have completed a fecal test in the past two years and/or colonoscopy/sigmoidoscopy in the last five years.
- The COVID-19 pandemic may have affected service provision.

Data source: Provincial cancer agencies and programs
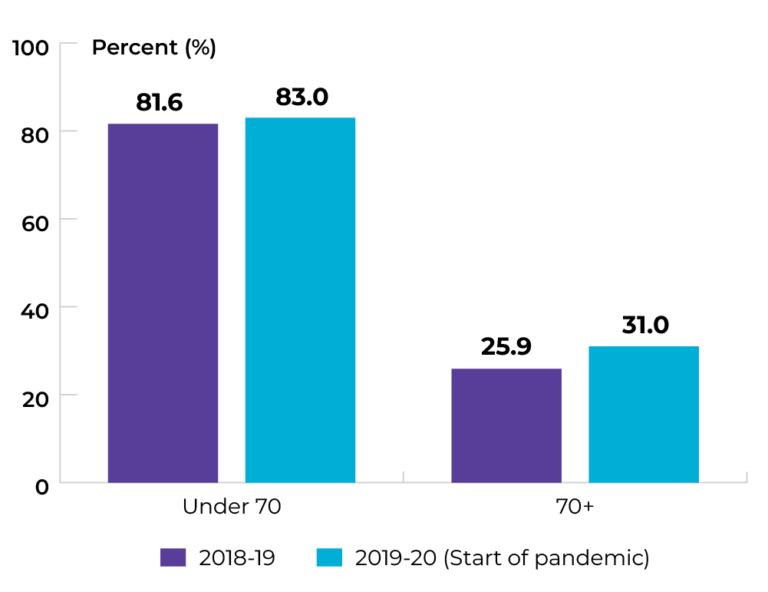
Topic: Increasing participation in colorectal cancer screening
Title of image: Percentage of individuals aged 50-74 who are up to date on colon cancer screening, by age group
Caveats/limitations:
- Up to date for screening describes individuals 50-74 years of age who have completed a fecal test in the past two years and/or colonoscopy/sigmoidoscopy in the last five years
- The COVID-19 pandemic may have affected service provision.

Data source: Provincial cancer agencies and programs
Topic: Increasing participation in colorectal cancer screening
Title of image: Percentage of individuals aged 50-74 who are up to date on colon cancer screening, by Regional Health Authority.
Caveats/limitations:
- Up to date for screening describes individuals 50-74 years of age who completed a fecal test in the past two years and/or colonoscopy/sigmoidoscopy in the last five years.
- The COVID-19 pandemic may have affected service provision.

Data source: Provincial cancer agencies and programs
Priority 3 Action 1: Set best practices and standards for care delivery and promote their adoption
Topic: Implementing multidisciplinary care for pediatric cancer patients
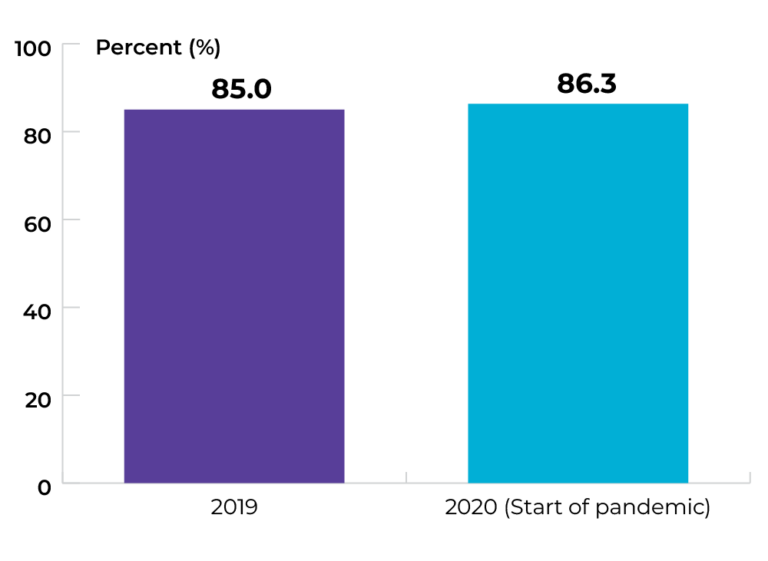
Title of image: Percentage of pediatric patients with cancer who were discussed by a multidisciplinary care team case conference prior to treatment
Caveats/limitations: The COVID-19 pandemic may have affected service provision.
Data source: Provincial cancer agencies and programs
Topic: Implementing multidisciplinary care for pediatric cancer patients
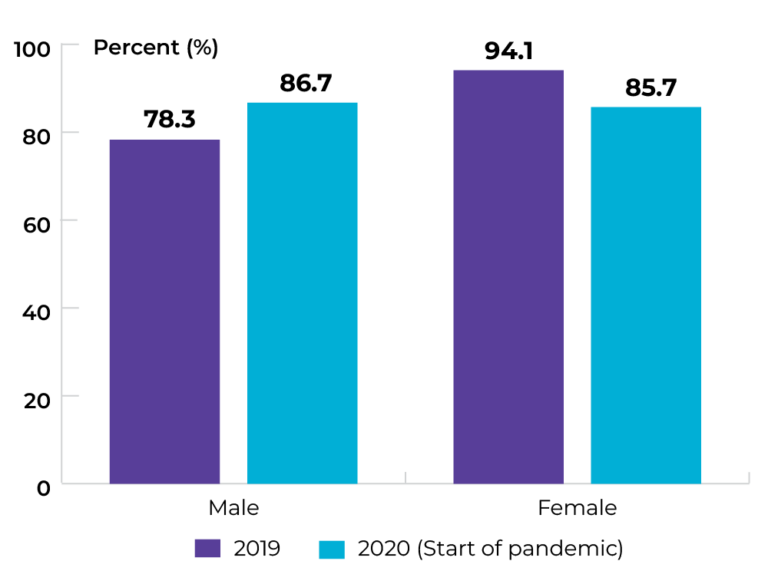
Title of image: Percentage of pediatric patients with cancer who were discussed by a multidisciplinary care team case conference prior to treatment, by sex
Caveats/limitations:
- Reporting breakdown by sex may be inadvertently misleading. The decision about which pediatric cancer cases are to be discussed by multidisciplinary teams (MDTs) is informed by the patient’s cancer diagnosis, not their sex.
- The COVID-19 pandemic may have affected service provision.
Data source: Provincial cancer agencies and programs
Topic: Implementing multidisciplinary care for pediatric cancer patients
Title of image: Percentage of pediatric patients with cancer who were discussed by a multidisciplinary care team case conference prior to treatment, by age group
Caveats/limitations: The COVID-19 pandemic may have affected service provision.
Data source: Provincial cancer agencies and programs
Topic: Implementing multidisciplinary care for gastrointestinal (GI) cancer patients
Title of image: Percentage of patients with GI cancer who were discussed by a multidisciplinary care team case conference prior to treatment
Caveats/limitations: The COVID-19 pandemic may have affected service provision.
Data source: Provincial cancer agencies and programs
Topic: Implementing multidisciplinary care for gastrointestinal (GI) cancer patients
Title of image: Percentage of patients with GI cancer who were discussed by a multidisciplinary care team case conference prior to treatment, by sex
Caveats/limitations: The COVID-19 pandemic may have affected service provision.

Data source: Provincial cancer agencies and programs
Topic: Implementing multidisciplinary care for gastrointestinal (GI) cancer patients
Title of image: Percentage of patients with GI cancer who were discussed by a multidisciplinary care team case conference prior to treatment, by age group
Caveats/limitations: The COVID-19 pandemic may have affected service provision.

Data source: Provincial cancer agencies and programs
Topic: Implementing multidisciplinary care for gastrointestinal (GI) cancer patients
Title of image: Percentage of patients with GI cancer who were discussed by a multidisciplinary care team case conference prior to treatment, by geography
Caveats/limitations: The COVID-19 pandemic may have affected service provision.

Data source: Provincial cancer agencies and programs
Priority 3 Action 2: Eliminate low-benefit practices and adopt high-value practices
Topic: Optimizing care at end of life
Title of image: Percentage of cancer patients who received their first systemic therapy treatment (i.e., cycle 1 day 1) within the last 15 days of life and who died of cancer-specific causes in 2018-19, overall and by sex
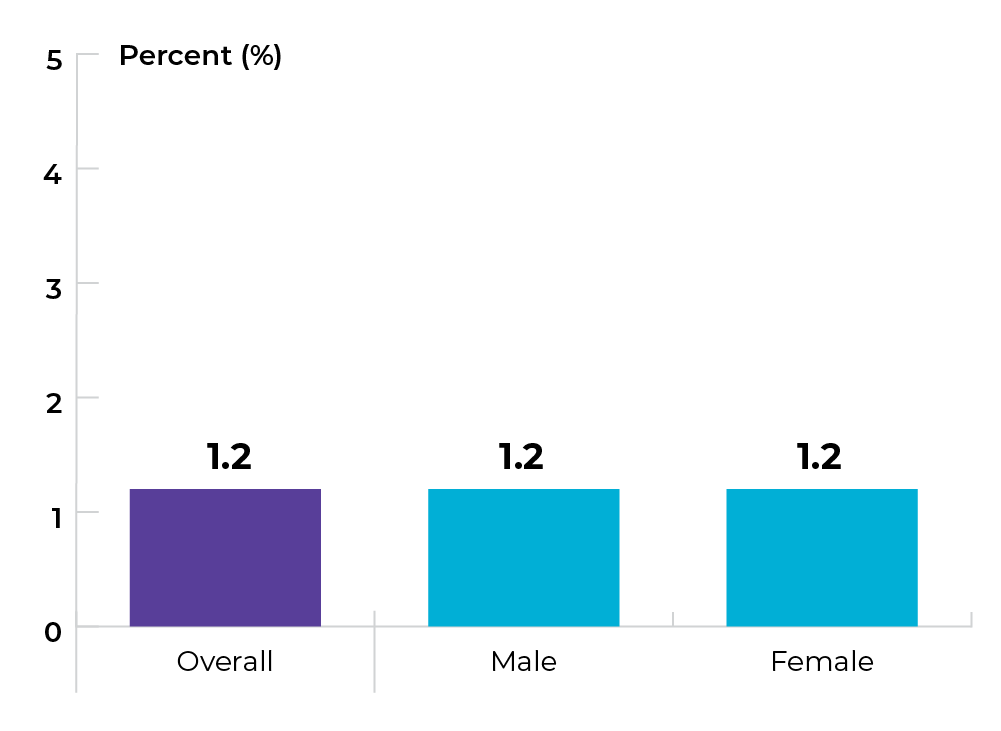
Data source: Provincial cancer agencies and programs
Topic: Optimizing care at end of life
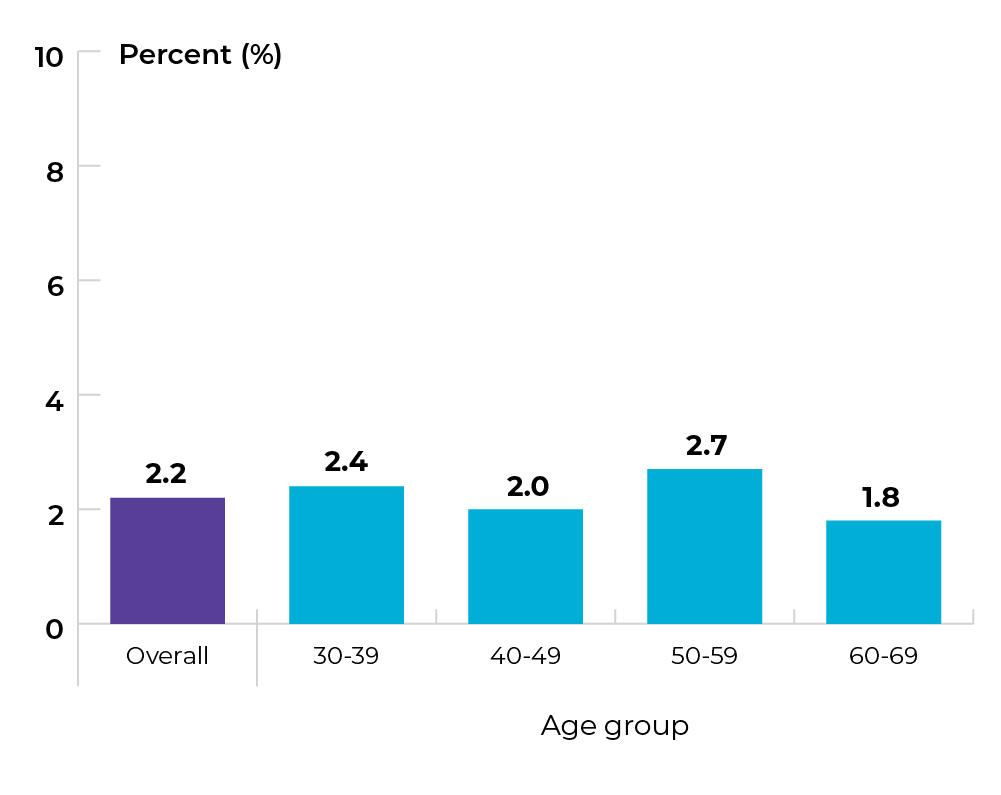
Title of image: Percentage of cancer patients who received their first systemic therapy treatment (i.e., cycle 1 day 1) within the last 15 days of life and who died of cancer-specific causes in 2018-19, by age group

Data source: Provincial cancer agencies and programs
Topic: Optimizing care at end of life
Title of image: Percentage of cancer patients who received their first systemic therapy treatment (i.e., cycle 1 day 1) within the last 15 days of life and who died from cancer-specific causes in 2018-19, by geography

Data source: Provincial cancer agencies and programs
Topic: Optimizing screening and appropriate follow-up
Title of image: Percentage of individuals who received a Pap test who were outside recommended age categories for cervical cancer screening guidelines (18-20 years old or 70 and older)
Caveats/limitations:
- The COVID-19 pandemic may have affected service provision.
- >69 years of age may not be inappropriate. Screening should be discontinued at >69 years only if the patient has had 3 negative pap tests in the past 10 years or one negative high-risk HPV test in the last 5 years.
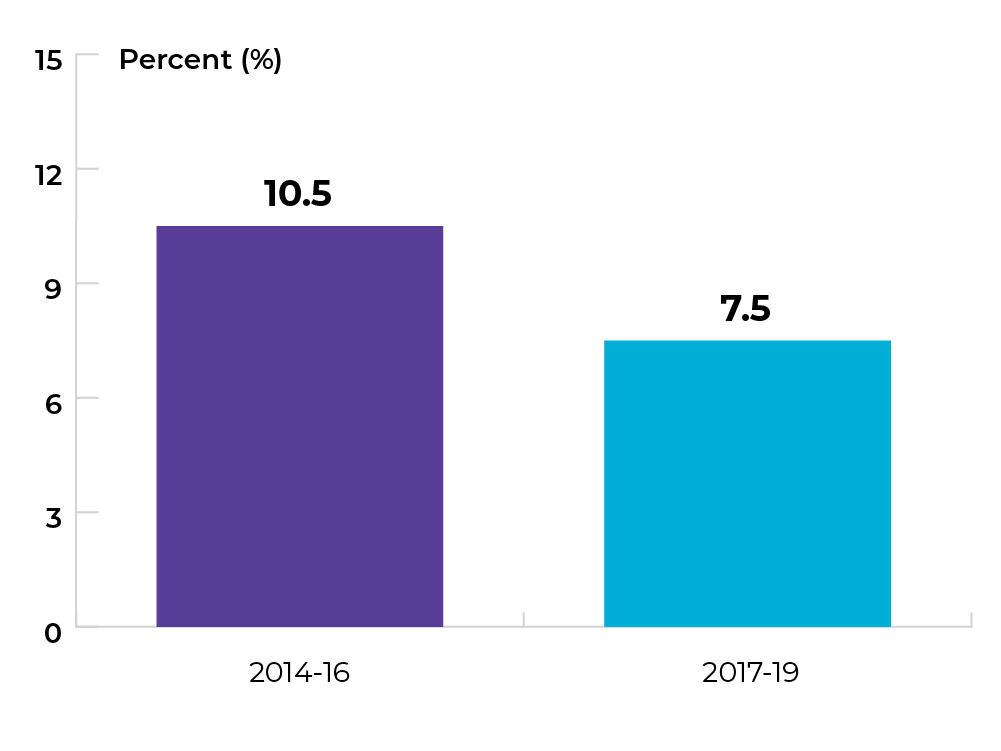
Data source: Provincial cancer agencies and programs
Topic: Optimizing screening and appropriate follow-up
Title of image: Percentage of individuals aged 21-69 who had two or more screening Pap tests completed within 36 months of the index Pap test (by interval; these individuals have completed specified tests despite having a normal screening result for the index Pap test)
Caveats/limitations: The COVID-19 pandemic may have affected service provision.

Data source: Provincial cancer agencies and programs
Priority 3 Action 3: Design and implement new models of care
Topic: Expanding models of care
Title of image: Proportion of Pap test specimens tested for high-risk HPV (hrHPV) between 2022-24, overall and by age group
Data source: Provincial cancer agencies and programs
Topic: Expanding models of care
Title of image: Proportion of Pap test specimens tested for hrHPV between 2022-24, by Regional Health Authority

Data source: Provincial cancer agencies and programs
Priority 4 Action 1: Provide better services and care adapted to the specific needs of underserved groups
Topic: Increasing access to culturally safe care
Title of image: Percentage of respondents to the Ambulatory Oncology Patient Satisfaction Survey who reported a positive response to the question, “Did your care providers treat you with dignity and respect?”
Caveats/limitations:
- Positive responses were identified as “Yes, completely” or “Yes, somewhat.”
- The COVID-19 pandemic may have affected service provision.
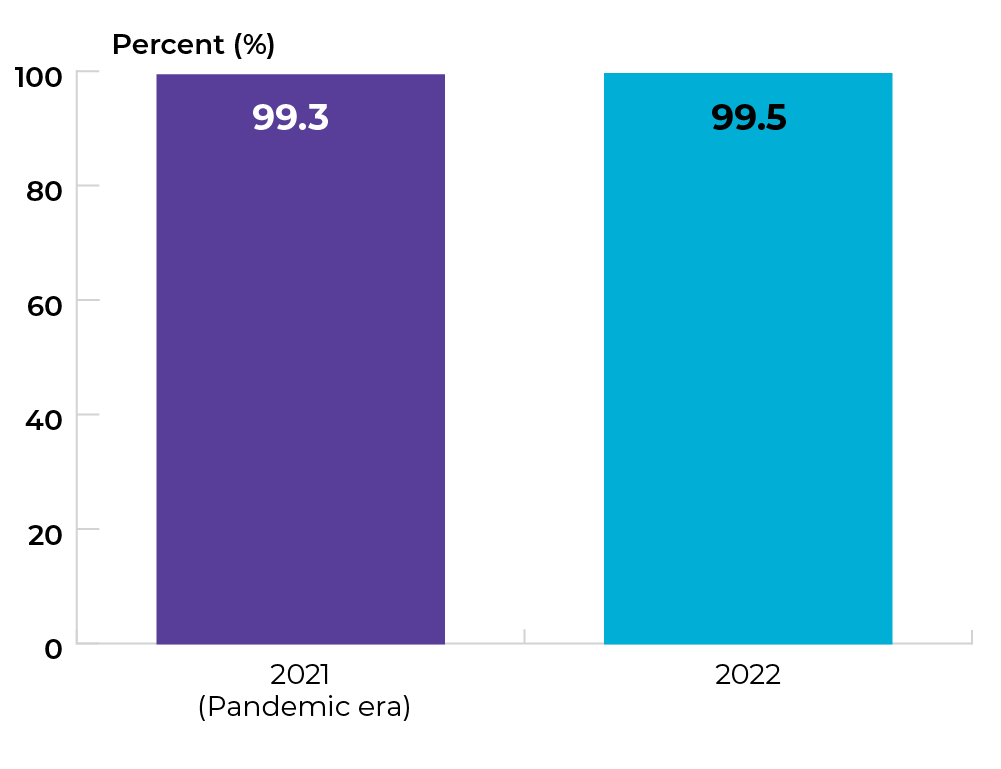
Data source: Ambulatory Oncology Patient Satisfaction Survey
Topic: Increasing access to culturally safe care
Title of image: Percentage of respondents to the Ambulatory Oncology Patient Satisfaction Survey who reported a positive response to the question, “Did your care providers treat you with dignity and respect?” by sex
Caveats/limitations:
- Positive responses were identified as “Yes, completely” or “Yes, somewhat.”
- The COVID-19 pandemic may have affected service provision.

Data source: Ambulatory Oncology Patient Satisfaction Survey
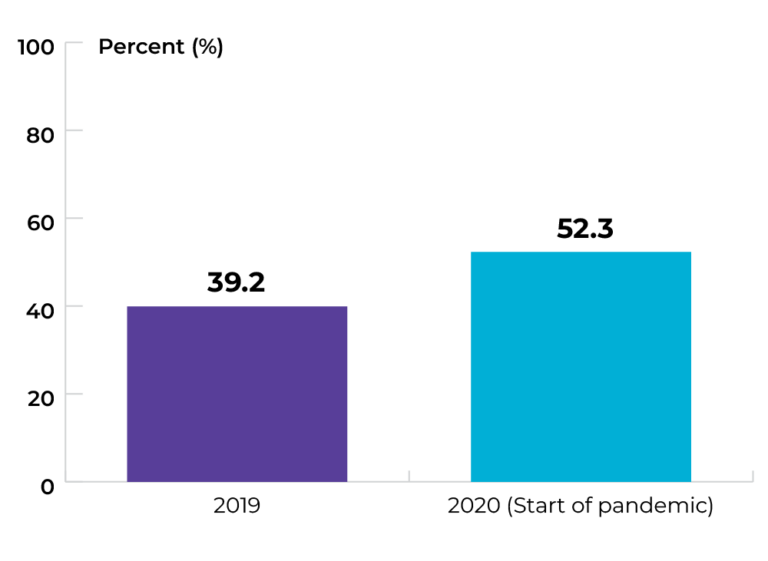
Topic: Increasing support to help patients navigate the system
Title of image: Percentage of rural/remote Manitobans living with cancer who accessed CancerCare Manitoba’s Navigation Services, by fiscal year
Caveats/limitations:
- For this indicator, rural/remote is defined as Regional Health Authorities outside of the Winnipeg Regional Health Authority (RHA). This includes Interlake Eastern (RHA), Northern RHA, Prairie Mountain Health, and Southern Health – Santé Sud.
- The COVID-19 pandemic may have affected service provision.
Data source: Provincial cancer agencies and programs
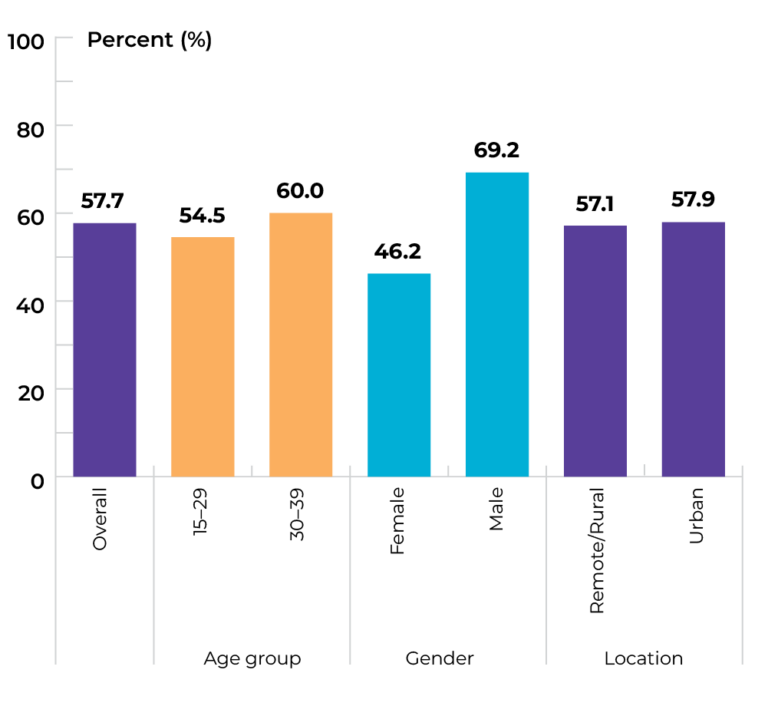
Topic: Increasing support to help patients navigate the system
Title of image: Percentage of rural/remote Manitobans living with cancer who accessed CancerCare Manitoba’s Navigation Services in fiscal year 2021-22, by sex
Caveats/limitations:
- For this indicator, rural/remote is defined as Regional Health Authorities outside of the Winnipeg Regional Health Authority (RHA). This includes Interlake Eastern (RHA), Northern RHA, Prairie Mountain Health, and Southern Health – Santé Sud.
- The COVID-19 pandemic may have affected service provision.

Data source: Provincial cancer agencies and programs
Topic: Increasing support to help patients navigate the system
Title of image: Percentage of rural/remote Manitobans living with cancer who accessed CancerCare Manitoba’s Navigation Services in fiscal year 2021-22, by age
Caveats/limitations:
- For this indicator, rural/remote is defined as Regional Health Authorities outside of the Winnipeg Regional Health Authority (RHA). This includes Interlake Eastern (RHA), Northern RHA, Prairie Mountain Health, and Southern Health – Santé Sud.
- The COVID-19 pandemic may have affected service provision.

Data source: Provincial cancer agencies and programs
Topic: Increasing support to help patients navigate the system
Title of image: Percentage of rural/remote Manitobans living with cancer who accessed CancerCare Manitoba’s Navigation Services in fiscal year 2021-22, by Regional Health Authority
Caveats/limitations:
- For this indicator, rural/remote is defined as Regional Health Authorities outside of the Winnipeg Regional Health Authority (RHA). This includes Interlake Eastern (RHA), Northern RHA, Prairie Mountain Health, and Southern Health – Santé Sud.
- The COVID-19 pandemic may have affected service provision.

Data source: Provincial cancer agencies and programs
Priority 4 Action 2: Ensure rural and remote communities have the resources required to better serve their people
Topic: Increasing access to virtual care
Title of image: Percentage of Manitobans newly diagnosed with cancer and living in rural/remote Regional Health Authorities who attended virtual physician visit appointments, by patient and appointment level
Caveats and limitations:
- Winnipeg was not included as it is not rural.
- The COVID-19 pandemic may have affected service provision.
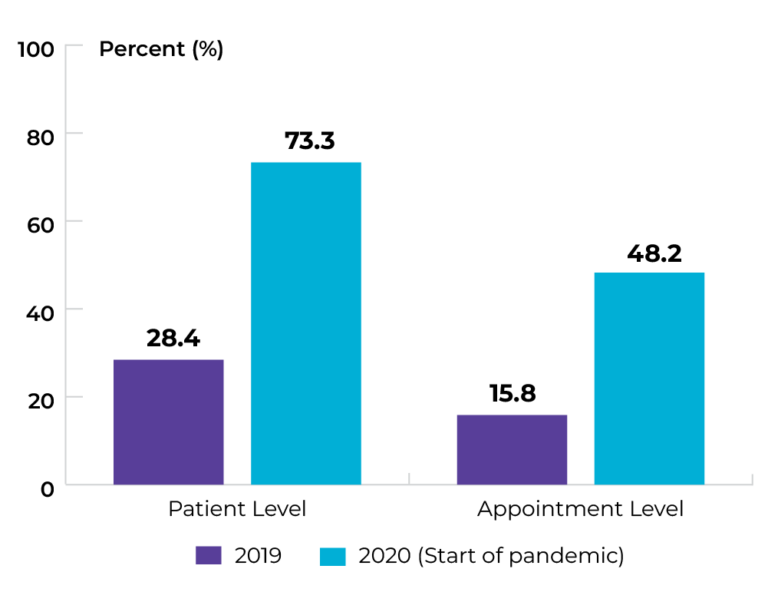
Data source: Provincial cancer agencies and programs
Topic: Increasing access to virtual care
Title of image: Percentage of Manitobans newly diagnosed with cancer and living in rural/remote Regional Health Authorities who attended virtual physician visit appointments, by rural/remote Regional Health Authorities
Caveats and limitations:
- For this indicator, rural/remote is defined as Regional Health Authorities outside of the Winnipeg Regional Health Authority (RHA). This includes Interlake Eastern (RHA), Northern RHA, Prairie Mountain Health, and Southern Health – Santé Sud. Winnipeg RHA data are not included for this indicator.
- The COVID-19 pandemic may have affected service provision.
Data source: Provincial cancer agencies and programs
Topic: Increasing access to virtual care
Title of image: Percentage of Manitobans newly diagnosed with cancer and living in rural/remote Regional Health Authorities who attended virtual physician visit appointments, by age group
Caveats and limitations:
- The COVID-19 pandemic may have affected service provision.
- For this indicator, rural/remote is defined as Regional Health Authorities outside of the Winnipeg Regional Health Authority (RHA). This includes Interlake Eastern (RHA), Northern RHA, Prairie Mountain Health, and Southern Health – Santé Sud. Winnipeg RHA data are not included for this indicator.
Data source: Provincial cancer agencies and programs
Topic: Increasing access to supportive psychosocial care services
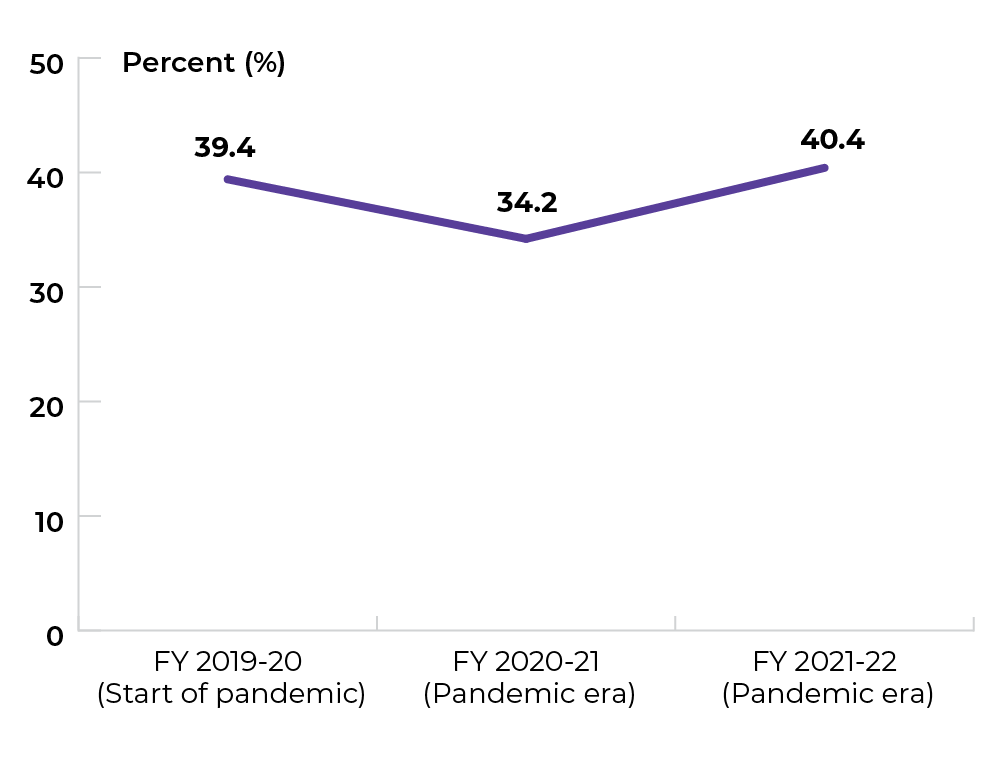
Title of image: Percentage of rural and remote cancer patients who were diagnosed with any invasive cancer and indicated willingness to access psychosocial support, by fiscal year
Caveats/limitations:
- The COVID-19 pandemic may have affected service provision.
- For this indicator, rural/remote is defined as Regional Health Authorities outside of the Winnipeg Regional Health Authority (RHA). This includes Interlake Eastern (RHA), Northern RHA, Prairie Mountain Health, and Southern Health – Santé Sud. Winnipeg RHA data are not included for this indicator.
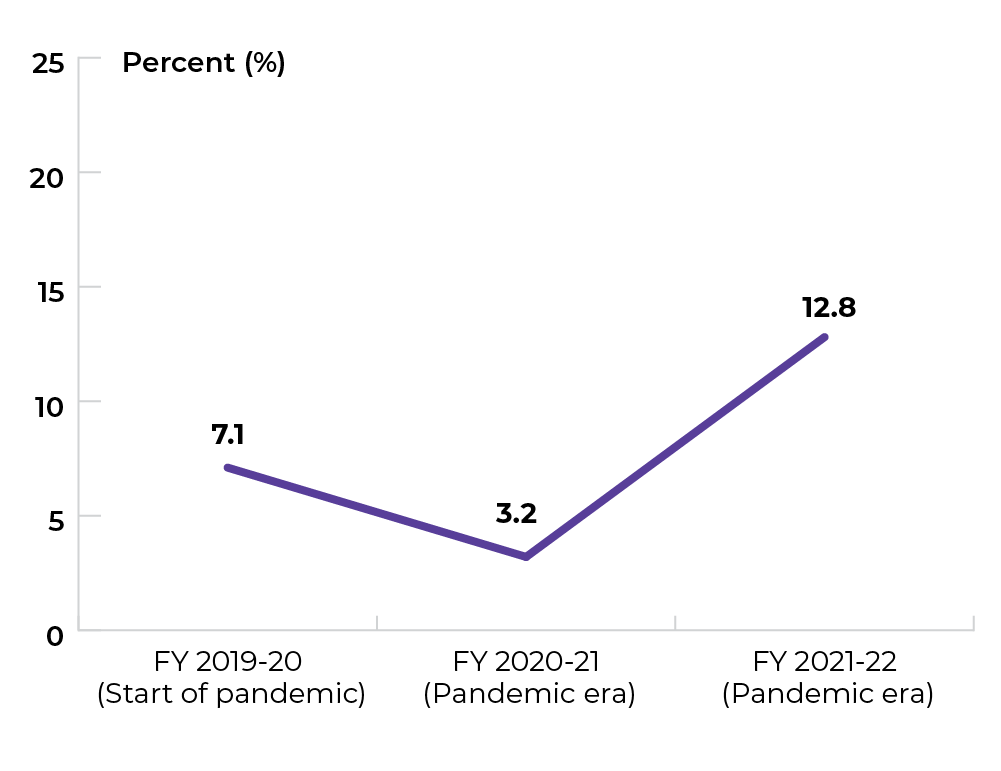
Data source: Provincial cancer agencies and programs
Priority 5 Action 1: Integrate the full spectrum of information and support services to ensure people are fully supported throughout the cancer experience
Topic: Improving availability of information and support
Title of image: Percentage of respondents to the Ambulatory Oncology Patient Satisfaction Survey who reported a positive response to questions related to whether they received enough information across five themes
Caveats/limitations:
- The COVID-19 pandemic may have affected service provision.
- The themes reflect positive responses to the following AOPSS questions:
- Referral: “When you were first told of your illness, were you referred to a care provider who could help you with your anxieties and fears?”
- Emotions: “Did you get enough information about possible changes in your emotions?”
- Energy/Fatigue: “Did you get enough information about possible changes in your energy/fatigue level?”
- Appearance: “Did you get enough information about possible changes to your physical appearance?”
- Treatment: Were you given enough information about therapies for treating cancer?”
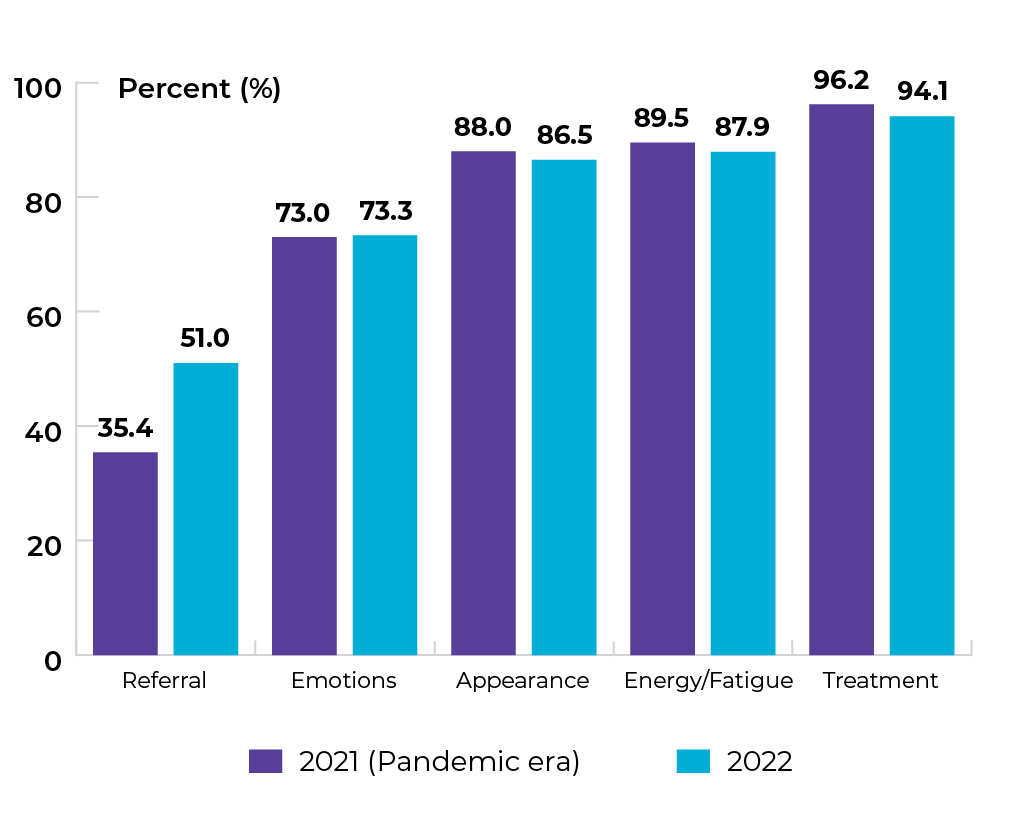
Data source: Ambulatory Oncology Patient Satisfaction Survey
Topic: Improving availability of information and support
Title of image: Percentage of male respondents to the Ambulatory Oncology Patient Satisfaction Survey who reported a positive response to questions related to whether they received enough information across five themes
Caveats/limitations:
- The COVID-19 pandemic may have affected service provision.
- The themes reflect positive responses to the following AOPSS questions:
- Referral: “When you were first told of your illness, were you referred to a care provider who could help you with your anxieties and fears?”
- Emotions: “Did you get enough information about possible changes in your emotions?”
- Energy/Fatigue: “Did you get enough information about possible changes in your energy/fatigue level?”
- Appearance: “Did you get enough information about possible changes to your physical appearance?”
- Treatment: Were you given enough information about therapies for treating cancer?”

Data source: Ambulatory Oncology Patient Satisfaction Survey
Topic: Improving availability of information and support
Title of image: Percentage of female respondents to the Ambulatory Oncology Patient Satisfaction Survey who reported a positive response to questions related to whether they received enough information across five themes
Caveats/limitations:
- The COVID-19 pandemic may have affected service provision.
- The themes reflect positive responses to the following AOPSS questions:
- Referral: “When you were first told of your illness, were you referred to a care provider who could help you with your anxieties and fears?”
- Emotions: “Did you get enough information about possible changes in your emotions?”
- Energy/Fatigue: “Did you get enough information about possible changes in your energy/fatigue level?”
- Appearance: “Did you get enough information about possible changes to your physical appearance?”
- Treatment: Were you given enough information about therapies for treating cancer?”

Data source: Ambulatory Oncology Patient Satisfaction Survey
Topic: Improving availability of information and support
Title of image: Percentage of respondents to the Ambulatory Oncology Patient Satisfaction Survey who reported a positive response to questions related to whether they received enough information across five themes, by Regional Health Authority
Caveats/limitations:
- The COVID-19 pandemic may have affected service provision.
- The themes reflect positive responses to the following AOPSS questions:
- Referral: “When you were first told of your illness, were you referred to a care provider who could help you with your anxieties and fears?”
- Emotions: “Did you get enough information about possible changes in your emotions?”
- Energy/Fatigue: “Did you get enough information about possible changes in your energy/fatigue level?”
- Appearance: “Did you get enough information about possible changes to your physical appearance?”
- Treatment: Were you given enough information about therapies for treating cancer?”

Title of table: Percentage of respondents to the Ambulatory Oncology Patient Satisfaction Survey who reported a positive response to questions related to whether they received enough information across five themes, by Regional Health Authority
| Regional Health Authority | Referral | Emotions | Appearance | Energy/Fatigue | Treatment |
|---|---|---|---|---|---|
| Winnipeg RHA | 50.9% | 70.3% | 84.9% | 87.3% | 93.5% |
| Southern Health-Santé Sud | 47.7% | 71.3% | 83.6% | 87.0% | 94.4% |
| Interlake-Eastern RHA | 54.3% | 75.8% | 87.9% | 86.0% | 93.2% |
| Prairie Mountain Health | 51.7% | 79.9% | 91.3% | 91.5% | 95.4% |
| Northern RHA | 51.7% | 82.1% | 92.5% | 86.7% | 97.8% |
Data source: Ambulatory Oncology Patient Satisfaction Survey
Topic: Improving availability of information and support
Title of image: Percentage of respondents to the Ambulatory Oncology Patient Satisfaction Survey who reported a positive response to questions related to whether they received enough information across five themes, by age group
Caveats/limitations:
- The COVID-19 pandemic may have affected service provision.
- The themes reflect positive responses to the following AOPSS questions:
- Referral: “When you were first told of your illness, were you referred to a care provider who could help you with your anxieties and fears?”
- Emotions: “Did you get enough information about possible changes in your emotions?”
- Energy/Fatigue: “Did you get enough information about possible changes in your energy/fatigue level?”
- Appearance: “Did you get enough information about possible changes to your physical appearance?”
- Treatment: Were you given enough information about therapies for treating cancer?”

Title of table: Percentage of respondents to the Ambulatory Oncology Patient Satisfaction Survey who reported a positive response to questions related to whether they received enough information across five themes, by age group
| Age group | Referral | Emotions | Appearance | Energy/Fatigue | Treatment |
|---|---|---|---|---|---|
| 18-34 | 60.0% | 80.0% | 100.0% | 94.7% | 90.0% |
| 35-44 | 60.4% | 79% | 90.6% | 92.6% | 92.4% |
| 45-54 | 53.0% | 73.6% | 87.6% | 88.5% | 92.2% |
| 55-64 | 53.8% | 75.1% | 89.6% | 91.0% | 93.4% |
| 65+ | 49.1% | 72.2% | 84.7% | 86.6% | 94.6% |
Data source: Ambulatory Oncology Patient Satisfaction Survey
Topic: Improving access to shared medical records
Title of image: Percent of healthcare professionals* who currently have direct access to cancer patient information (i.e., are active users) within CancerCare Manitoba’s (CCMB) electronic medical record (ARIA)
Caveats/limitations:
- The COVID-19 pandemic may have affected service provision.
- *Here, healthcare professionals include the following seven physician classifications: Family Practitioner, General Practitioner, Physician, Palliative Care Physician, Emergency Medicine Physician, Family Physician in Oncology, and Community Cancer Program Physician.
Data source: Provincial cancer agencies and programs
Priority 5 Action 2: Address the limited and unequal access to palliative and end-of-life care across Canada
Topic: Improving access to quality end-of-life care
Title of image: Cumulative length of stay for cancer patients (overall) who were in or admitted to an acute care hospital 30 days prior to death in Manitoba, by fiscal year
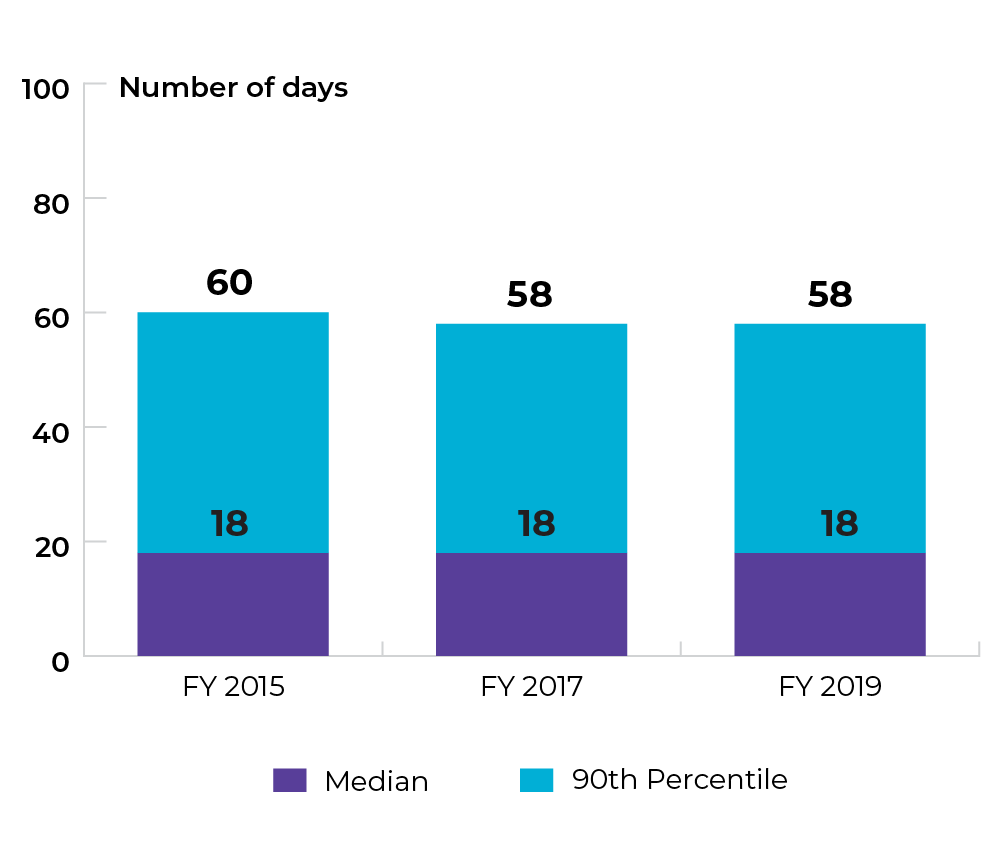
Data source: Canadian Institute for Health Information (CIHI), Discharge Abstract Database (DAD)
Topic: Improving access to quality end-of-life care
Title of image: Cumulative length of stay for cancer patients living in rural/remote Regional Health Authorities in Manitoba who were in or admitted to an acute care hospital 30 days prior to death, by fiscal year
Caveats/limitations: For this indicator, rural/remote is defined as Regional Health Authorities outside of the Winnipeg Regional Health Authority (RHA). This includes Interlake Eastern (RHA), Northern RHA, Prairie Mountain Health, and Southern Health – Santé Sud. Winnipeg RHA data are not included for this indicator.
 Data source: Canadian Institute for Health Information (CIHI), Discharge Abstract Database (DAD)
Topic: Improving access to quality end-of-life care
Title of image: Cumulative length of stay for cancer patients living in the single urban Regional Health Authority in Manitoba who were in or admitted to an acute care hospital 30 days prior to death in Manitoba, by fiscal year
Caveats/limitations: For this indicator, urban is defined as the only Winnipeg Regional Health Authority (RHA). This indicator excludes rural/remote RHAs such as Interlake Eastern (RHA), Northern RHA, Prairie Mountain Health, and Southern Health – Santé Sud.
 Data source: Canadian Institute for Health Information (CIHI), Discharge Abstract Database (DAD)
Priority 5 Action 3: Support children, adolescents and young adults at key transition points in their unique cancer journeys
Topic: Improving care for adolescents and young adults with cancer
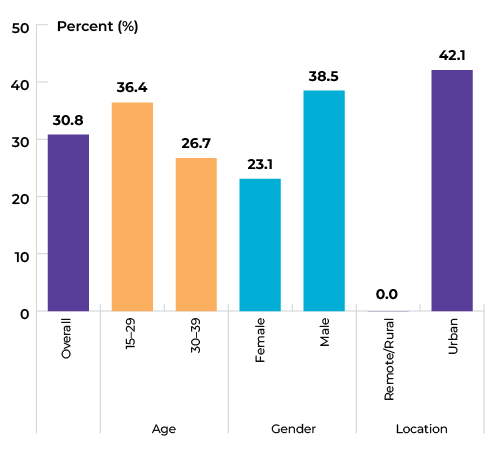
Title of image: Percentage of AYA with cancer who had a specialized care plan pathway
Caveats/limitations: The COVID-19 pandemic may have affected service provision.
Data source: Young Adult Cancer Canada (YACC) Survey 2021
Topic: Improving transitions for adolescents and young adults with cancer
Title of image: Percentage of AYA with cancer who had a positive experience of transition in care along their cancer journey
Caveats/limitations: The COVID-19 pandemic may have affected service provision.
Data source: Young Adult Cancer Canada (YACC) Survey 2021
The data tables and technical appendix for all indicators are available upon request at info@partnershipagainstcancer.ca. You will receive a response in two to three business days.