Supplementary data: Saskatchewan
This page provides data visualizations related to the priorities for Canada’s cancer system.
The data tables and technical appendix for all indicators are available upon request at info@partnershipagainstcancer.ca.
Priority 1 Action 1: Help people to stop smoking or not start in the first place and live healthier lives
Topic: Keeping people smoke-free
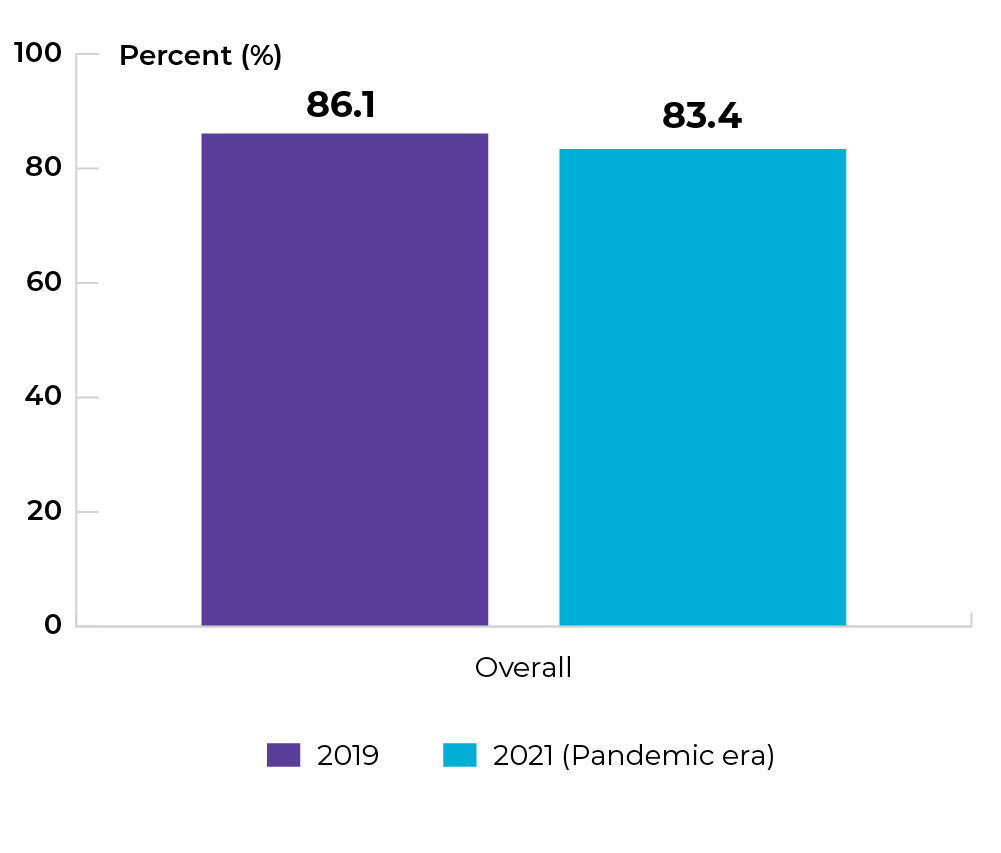
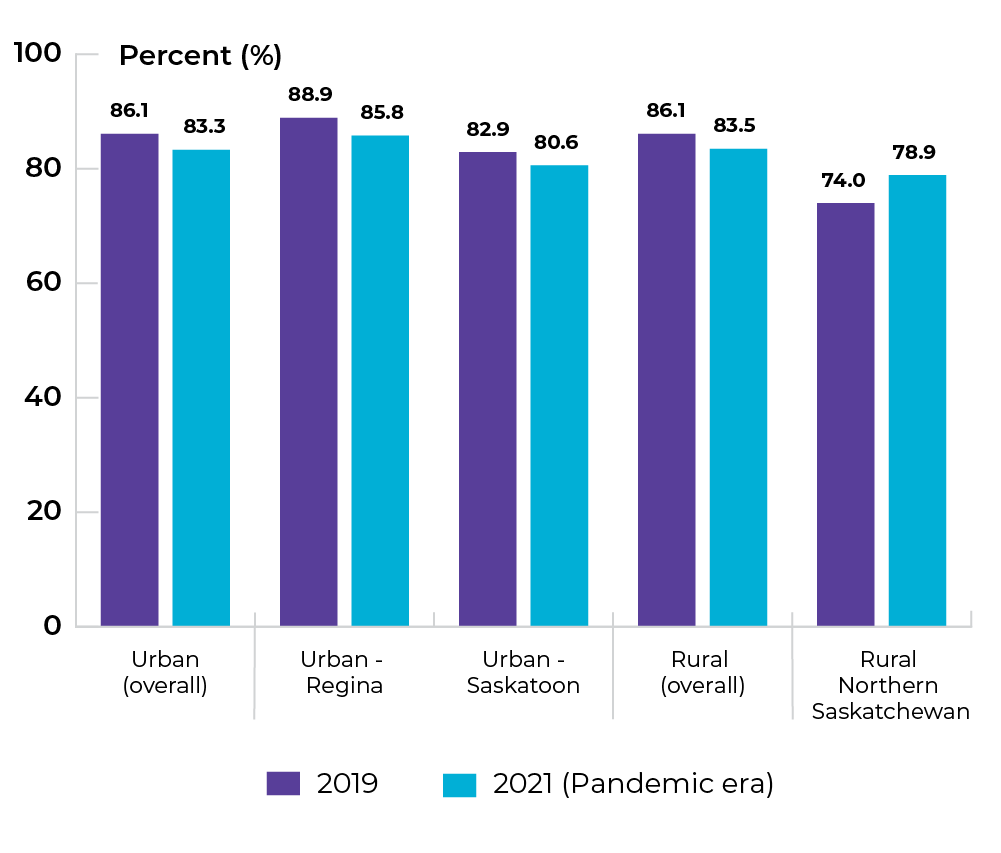
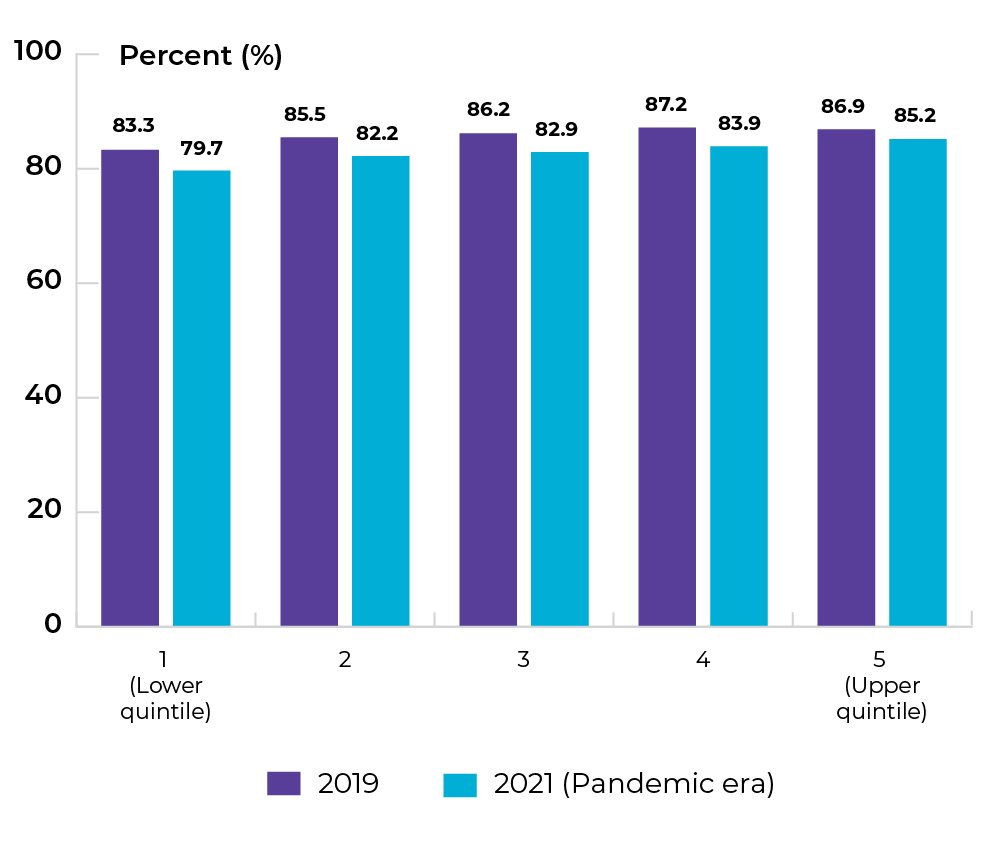
Title of image: Percentage of individuals in SK (aged ≥ 12) classified as daily or occasional smokers
Caveats/limitations:
- This indicator was reported using the Canadian Community Health Survey (CCHS).
- Individuals who did not respond to the required CCHS questions regarding smoking status were not included in the analysis.
- The COVID-19 pandemic had major impacts on the data collection operations and response rates for this survey.
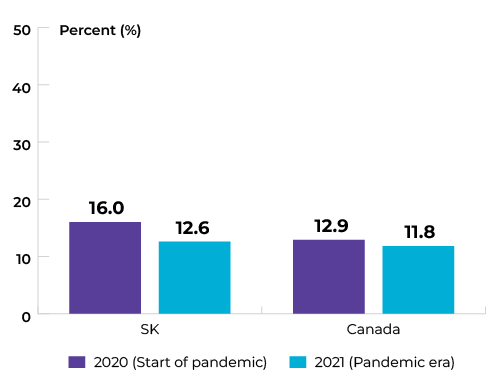 Data source: Canadian Community Health Survey
Topic: Keeping people smoke-free
Title of image: Percentage of males in SK (aged ≥ 18) classified as daily or occasional smokers , by income quintile
Caveats/limitations:
- The COVID-19 pandemic had major impacts on the data collection operations and response rates for this survey.
- Interpret with caution owing to large variability in the 2021 estimates.
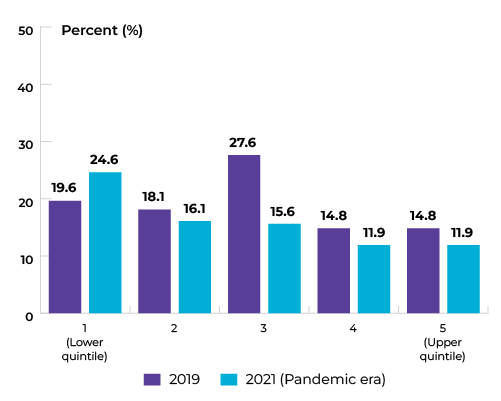
Data source: Canadian Community Health Survey
Topic: Keeping people smoke-free
Title of image: Percentage of females in SK (aged ≥ 18) classified as daily or occasional smokers, by income quintile
Caveats/limitations:
- The COVID-19 pandemic had major impacts on the data collection operations and response rates for this survey.
- Interpret with caution owing to large variability in the 2021 estimates .
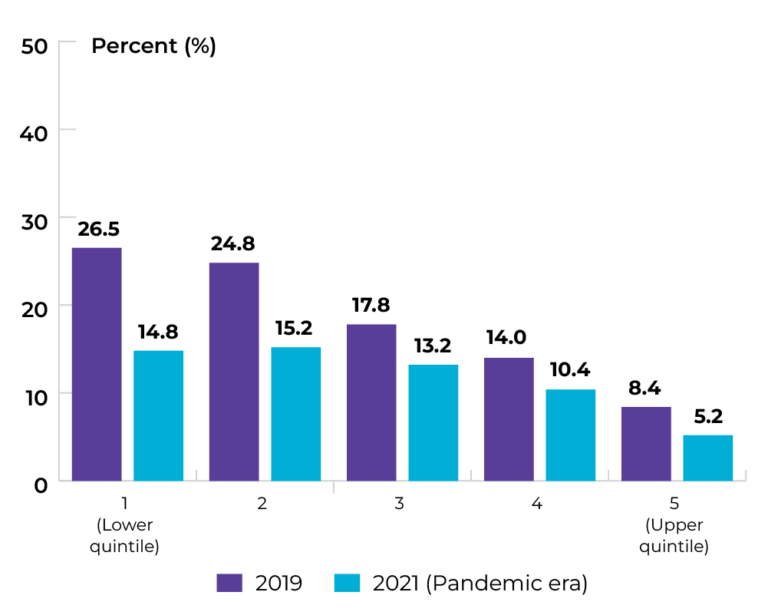 Data source: Canadian Community Health Survey
Topic: Keeping people smoke-free
Title of image: Percentage of males in SK (aged ≥ 18) classified as daily or occasional smokers , by highest level of education
Caveats/limitations:
- The COVID-19 pandemic had major impacts on the data collection operations and response rates for this survey.
- Interpret with caution owing to large variability in the 2021 estimates.
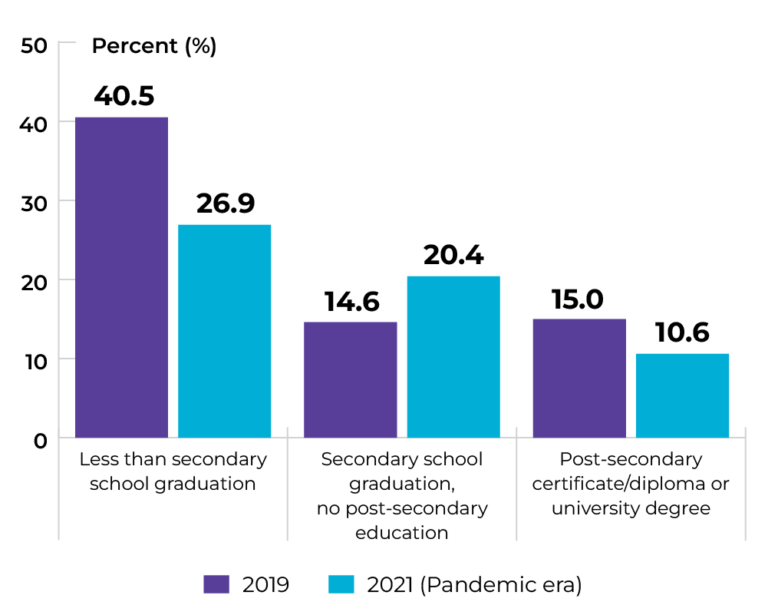
Data source: Canadian Community Health Survey
Topic: Keeping people smoke-free
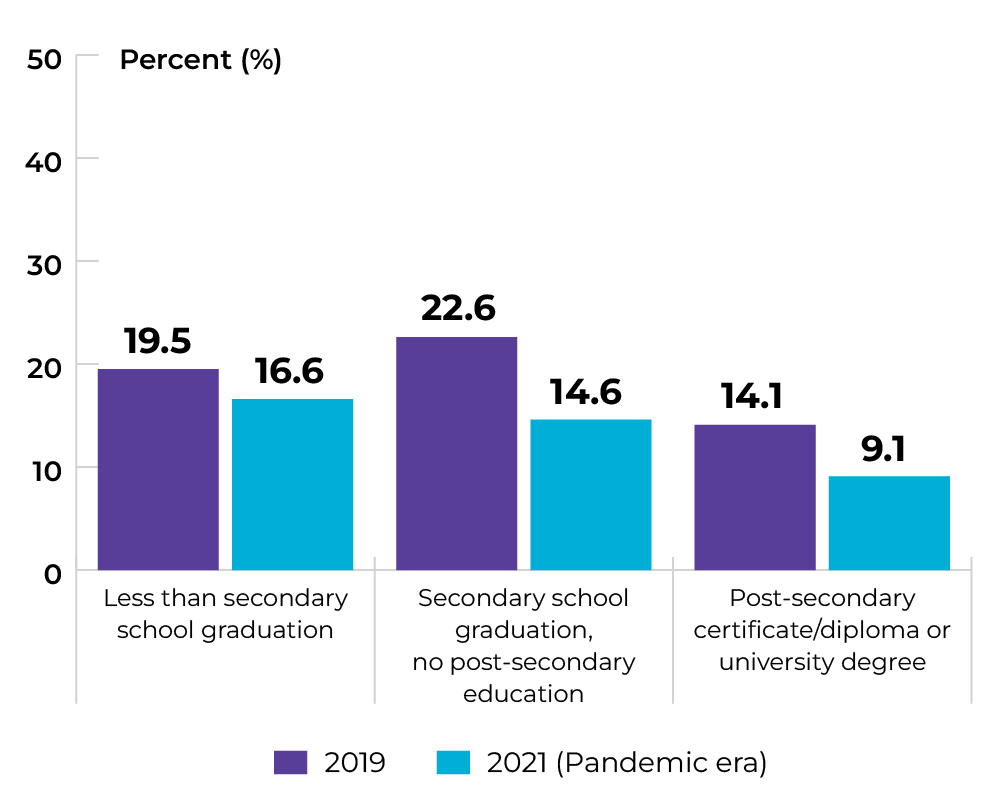
Title of image: Percentage of females in SK (aged ≥ 18) classified as daily or occasional smokers, by highest level of education
Caveats/limitations:
- The COVID-19 pandemic had major impacts on the data collection operations and response rates for this survey.
- Interpret with caution owing to large variability in the 2021 estimates.
 Data source: Canadian Community Health Survey
Topic: Maintaining healthy body weight
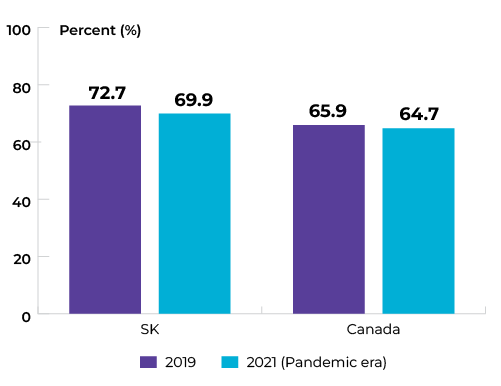
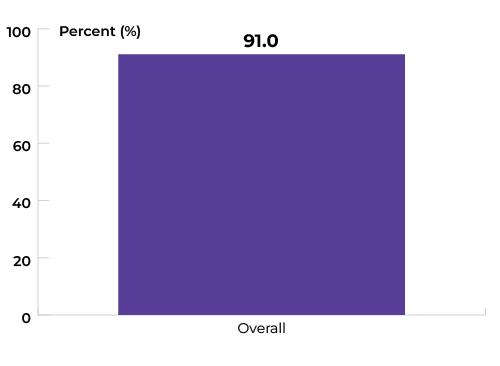
Title of image: Percentage of individuals in SK (aged ≥ 18) classified as overweight or obese
Caveats/limitations:
- This indicator was reported using the Canadian Community Health Survey (CCHS) and is based on self-reported data. Overall obesity and overweight percentages are reported using 2019 data. Percentages by income quintile and/or sex are reported using 2017-2018 data.
- Individuals who did not respond to the required CCHS questions to derive the BMI classifications were not included in the analysis.
- The COVID-19 pandemic had major impacts on the data collection operations and response rates for this survey.
Data source: Canadian Community Health Survey
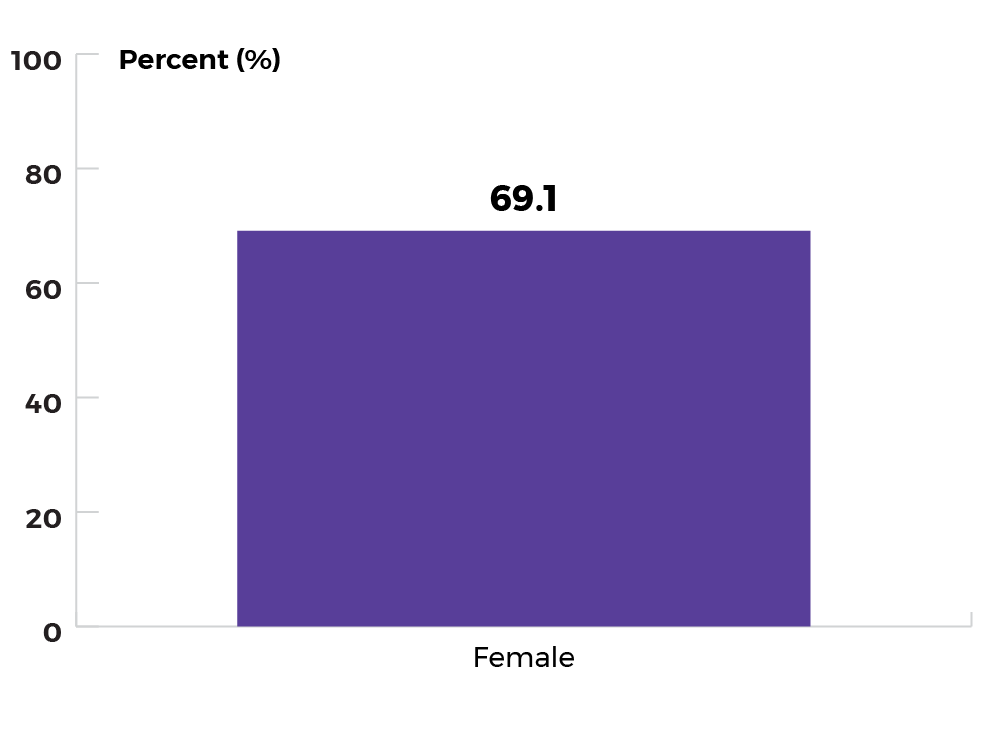
Topic: Maintaining healthy body weight
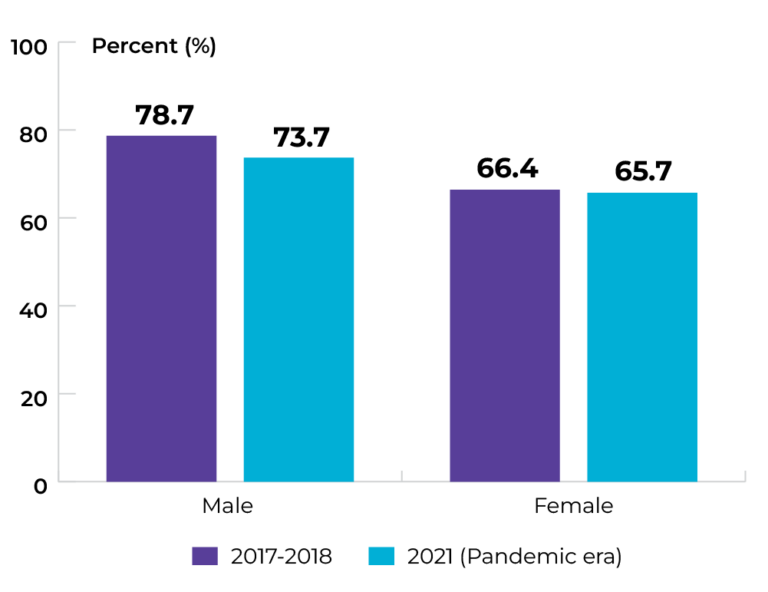
Title of image: Percentage of individuals in SK (aged ≥ 18) classified as overweight or obese, by sex
Caveats/limitations: The COVID-19 pandemic had major impacts on the data collection operations and response rates for this survey.
 Data source: Canadian Community Health Survey
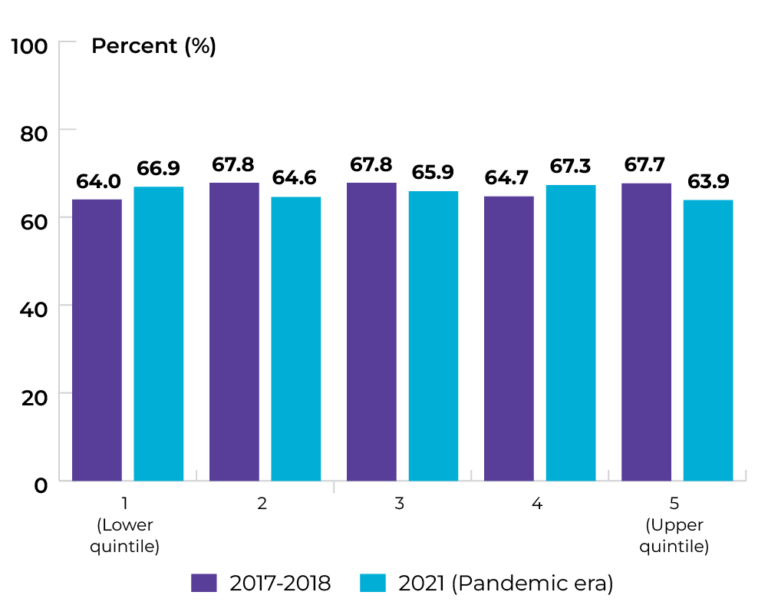
Topic: Maintaining healthy body weight
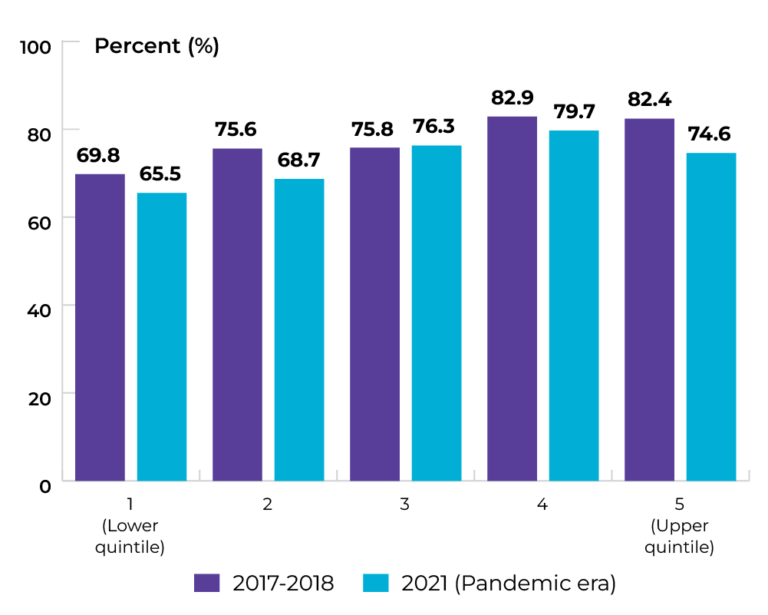
Title of image: Percentage of males in SK (aged ≥ 18) classified as overweight or obese, by income quintile
Caveats/limitations: The COVID-19 pandemic had major impacts on the data collection operations and response rates for this survey.
Data source: Canadian Community Health Survey
Topic: Maintaining healthy body weight
Title of image: Percentage of females in SK (aged ≥ 18) classified as overweight or obese, by income quintile
Caveats/limitations: The COVID-19 pandemic had major impacts on the data collection operations and response rates for this survey.
Data source: Canadian Community Health Survey
Priority 1 Action 2: Adopt proven practices known to reduce the risk of cancer
Topic: Increasing HPV vaccination
Title of image: Percentage of female Grade 6 students in SK who received final dose of HPV vaccination in the 2017 school year
Caveats/limitations: HPV vaccination rates for male Grade 6 students were not available.
 Data source: Provincial cancer agencies and programs
Priority 2 Action 1: Prioritize rapid access to appropriate diagnosis for those suspected of having cancer
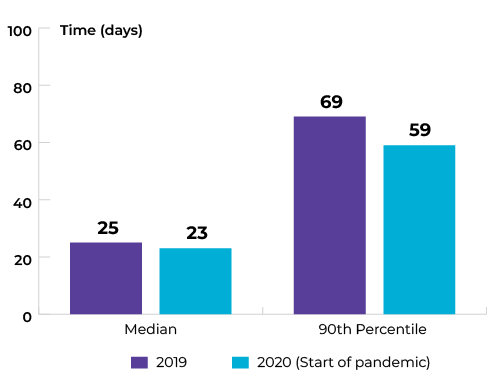
Topic: Reducing wait for diagnosis
Title of image: Time (in days) from last read date to diagnosis of breast cancer
Caveats/limitations:
- Includes only those who were screen detected through the Screening Program for Breast Cancer.
- The COVID-19 pandemic may have affected service provision.
 Data source: Provincial cancer agencies and programs
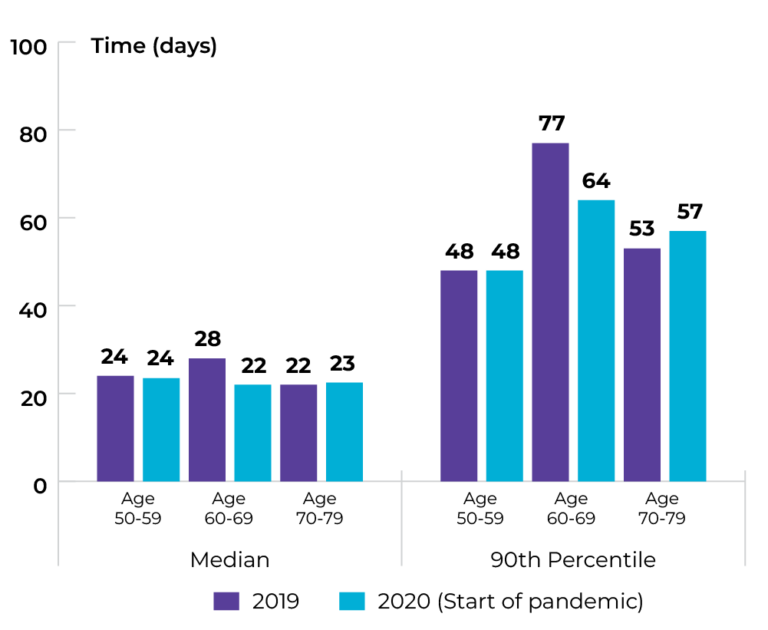
Topic: Reducing wait for diagnosis
Title of image: Time (in days) from last read date to diagnosis of breast cancer, by age group
Caveats/limitations:
- Includes only those who were screen detected through the Screening Program for Breast Cancer.
- The COVID-19 pandemic may have affected service provision.
Data source: Provincial cancer agencies and programs
Topic: Diagnosing cancer earlier
Title of image: Proportion of stage 4 diagnosis in SK
Caveats/limitations:
- Actual data by stage was not available for 2018. Average stage distribution from 2013-2017 was applied to the 2018 case counts for each cancer type to estimate stage distribution in 2018.
- Stage data not available for bladder and melanoma due to implementation of American Joint Committee on Cancer (AJCC) 8th Edition.
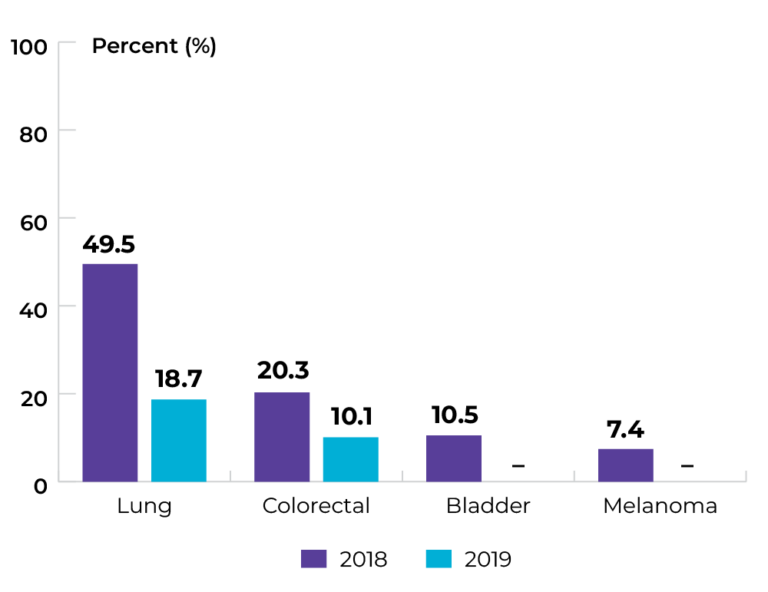
Data source: Provincial cancer agencies and programs
Priority 2 Action 2: Strengthen existing screening efforts and implement lung cancer screening programs across the country
Topic: Increasing participation in colorectal cancer screening
Title of image: Percentage of individuals who had FIT test in past two years and/or colonoscopy in the past seven years, by age group
Caveats/limitations: The COVID-19 pandemic may have affected service provision.
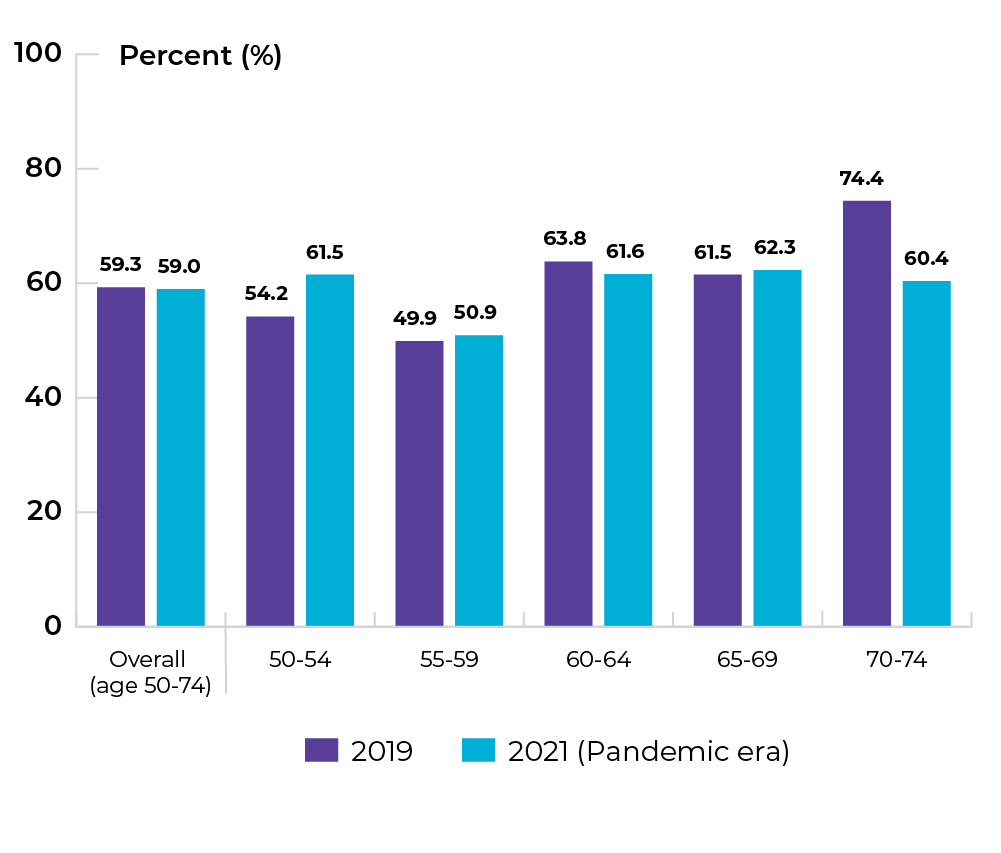 Data source: Provincial cancer agencies and programs
Topic: Increasing participation in colorectal cancer screening
Title of image: Percentage of males who had FIT test in past two years and/or colonoscopy in the past seven years, by age group
Caveats/limitations: The COVID-19 pandemic may have affected service provision.
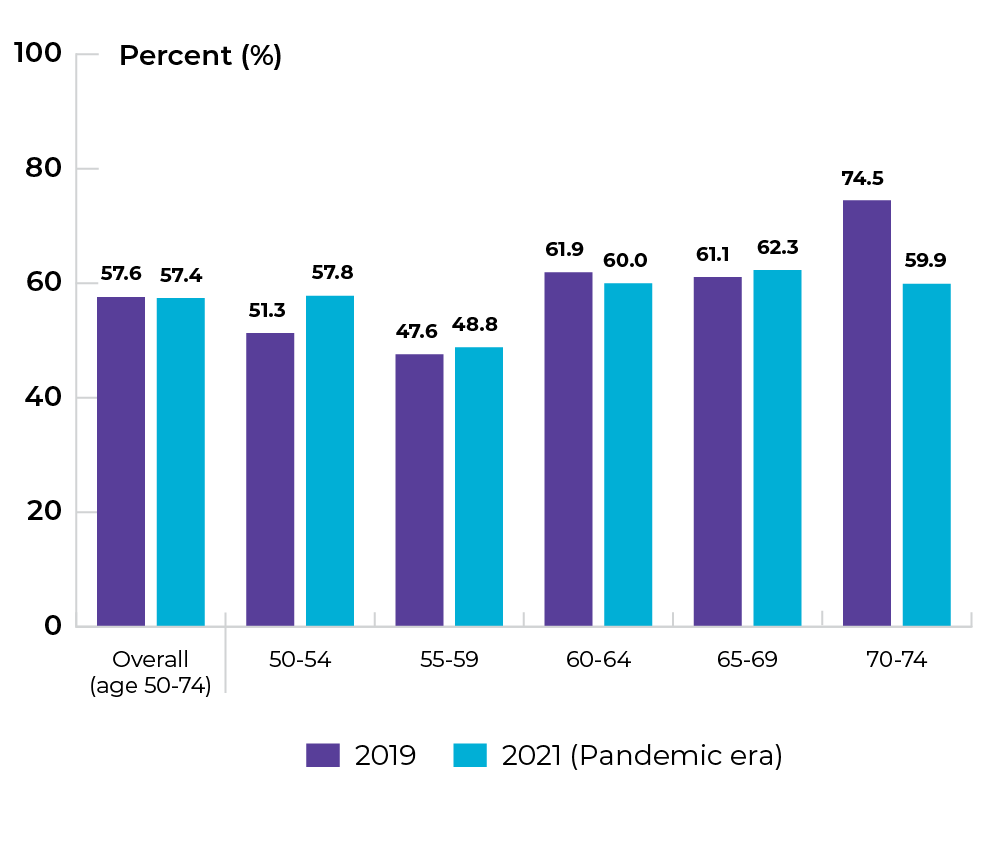 Data source: Provincial cancer agencies and programs
Topic: Increasing participation in colorectal cancer screening
Title of image: Percentage of females who had FIT test in past two years and/or colonoscopy in the past seven years, by age group
Caveats/limitations: The COVID-19 pandemic may have affected service provision.
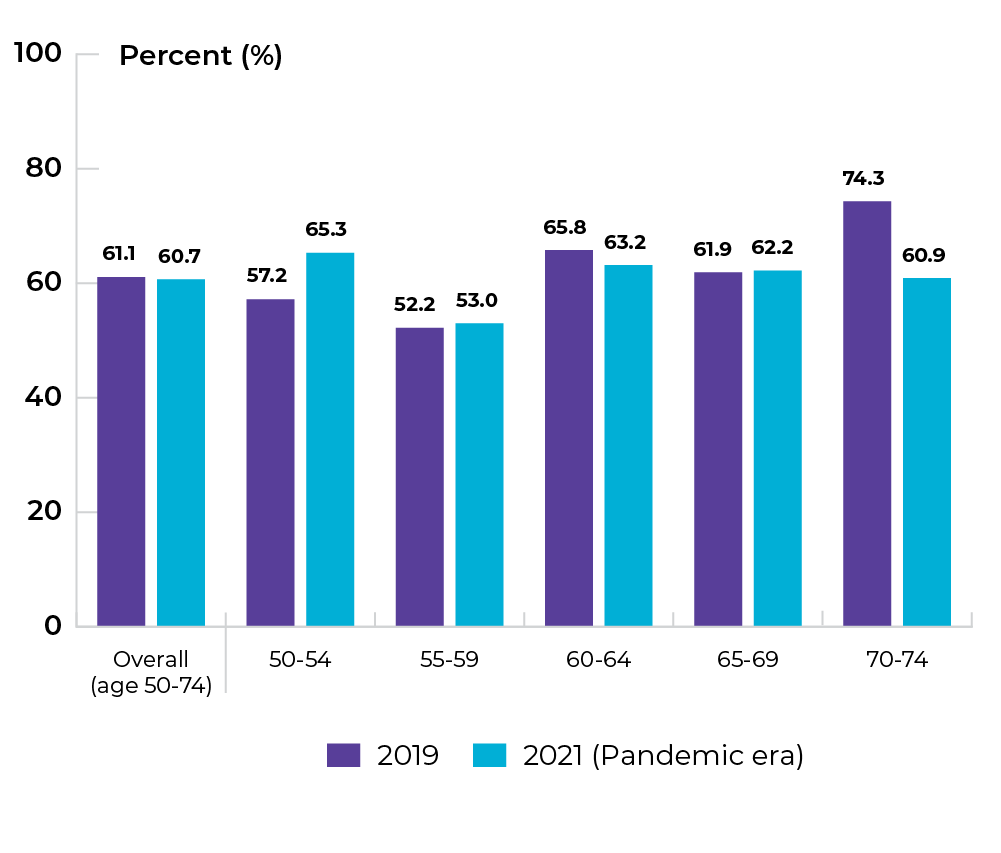 Data source: Provincial cancer agencies and programs
Priority 3 Action 1: Set best practices and standards for care delivery and promote their adoption
Topic: Implementing multidisciplinary care
Title of image: Percentage of new patients diagnosed with rectal cancer seen at the Saskatchewan Cancer Agency in a disease site-specific clinic in 2022
Caveats/limitations: The COVID-19 pandemic may have affected service provision.
Data source: Provincial cancer agencies and programs
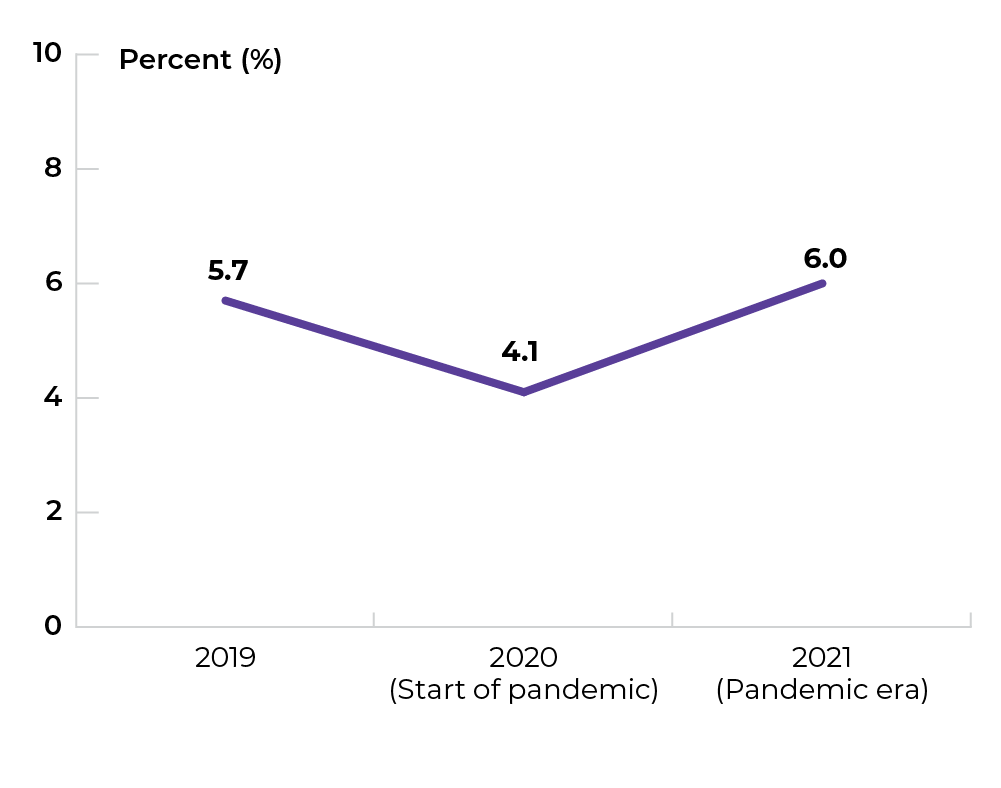
Priority 3 Action 2: Eliminate low-benefit practices and adopt high-value practices
Topic: Optimizing care at end of life
Title of image: Percentage of patients with cancer who died and received an IV or subcutaneous cancer drug treatment within 14 days of death
Caveats/limitations: The COVID-19 pandemic may have affected service provision.
Data source: Provincial cancer agencies and programs
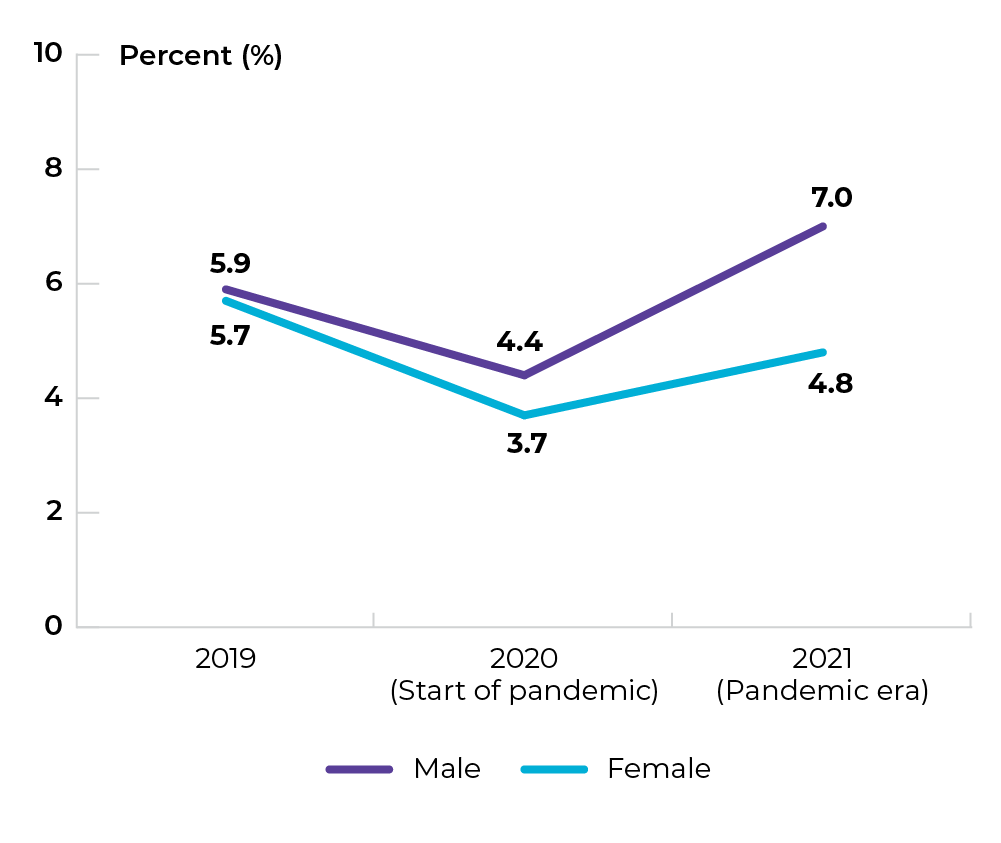
Topic: Optimizing care at end of life
Title of image: Percentage of patients with cancer who died and received an IV or subcutaneous cancer drug treatment within 14 days of death, by sex
Caveats/limitations: The COVID-19 pandemic may have affected service provision.
Data source: Provincial cancer agencies and programs
Topic: Optimizing care at end of life
Title of image: Percentage of patients with cancer who died and received an IV or subcutaneous cancer drug treatment within 14 days of death, by age group
Caveats/limitations: The COVID-19 pandemic may have affected service provision.
Note: Data for the 80+ age group is presented in the accompanying data table
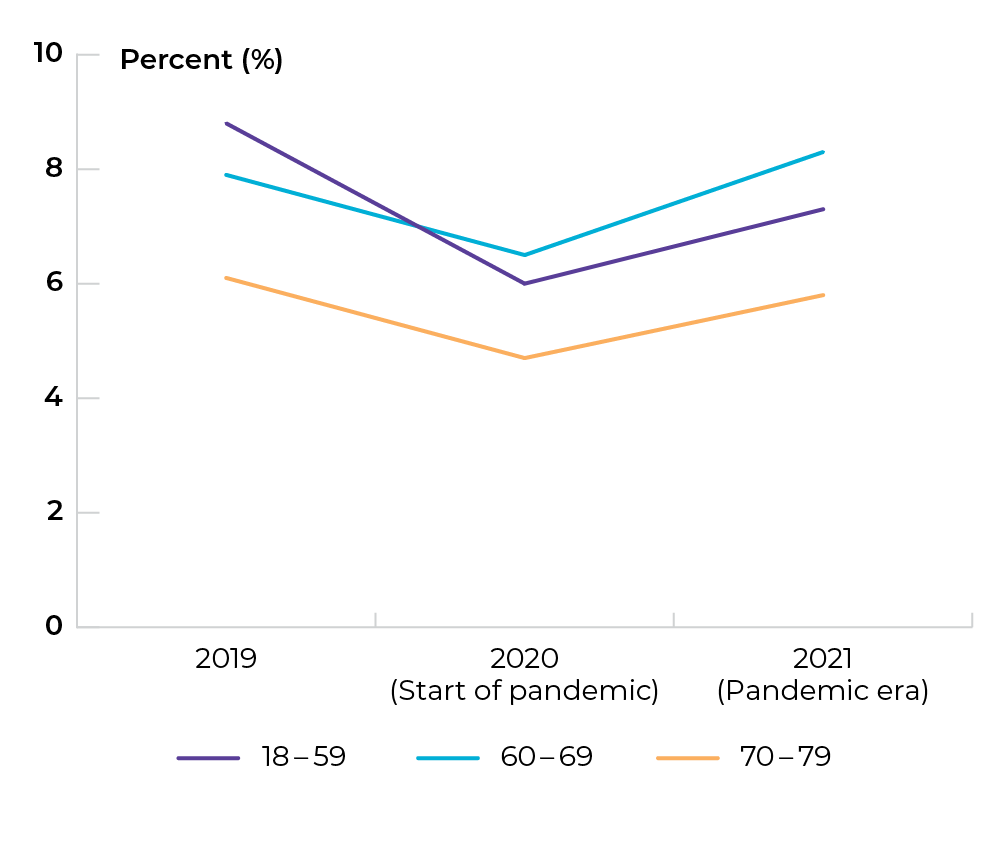
Title of table: Percentage of patients with cancer who died and received an IV or subcutaneous cancer drug treatment within 14 days of death, by age group
| Age group | 2019 | 2020 (Start of pandemic) | 2021 (Pandemic era) |
|---|---|---|---|
| 18-59 | 8.8% | 6.0% | 7.3% |
| 60-69 | 7.9% | 6.5% | 8.3% |
| 70-79 | 6.1% | 4.7% | 5.8% |
| 80+ | 1.7% | * | 3.8% |
*Suppressed owing to small numbers
Data source: Provincial cancer agencies and programs
Topic: Optimizing care at end of life
Title of image: Percentage of patients with cancer who died and received an IV or subcutaneous cancer drug treatment within 14 days of death, by cancer type
Caveats/limitations: The COVID-19 pandemic may have affected service provision.
Note: Data for colorectal cancer is presented in the accompanying data table
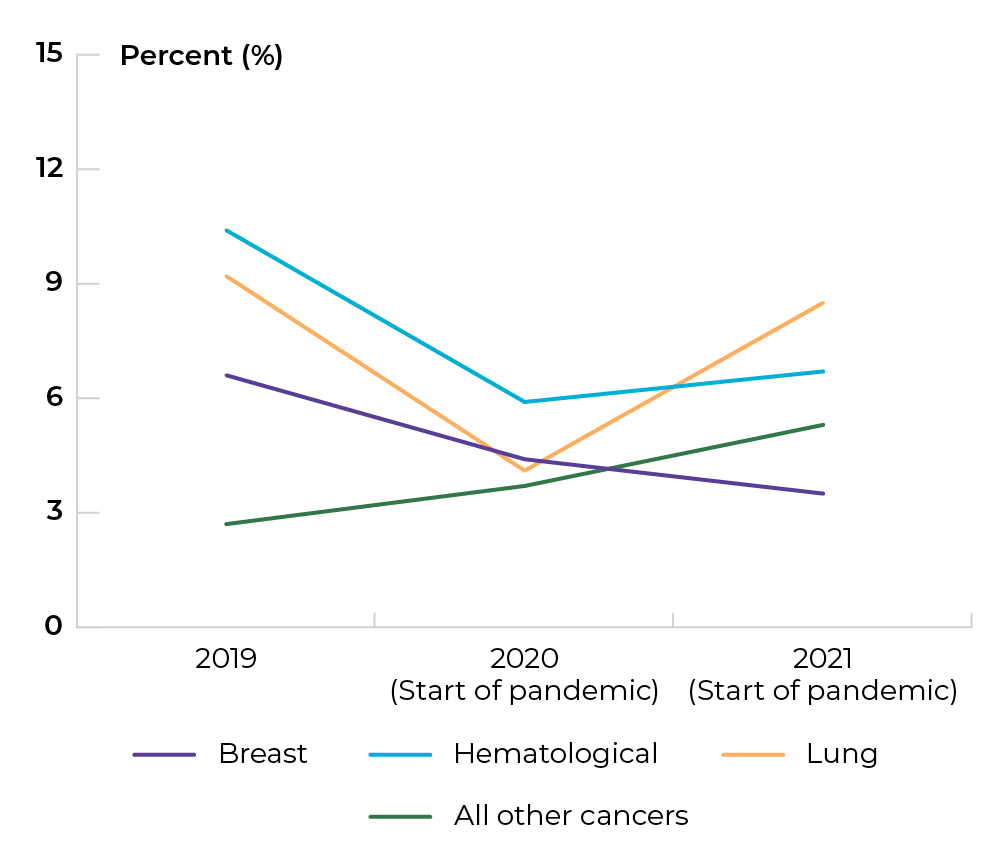
Title of table: Percentage of patients with cancer who died and received an IV or subcutaneous cancer drug treatment within 14 days of death, by cancer type
| Cancer type | 2019 | 2020 (Start of pandemic) | 2021 (Pandemic era) |
|---|---|---|---|
| Breast | 6.6% | 4.4% | 3.5% |
| Colorectal | 4.4% | * | 5.7% |
| Hematological | 10.4% | 5.9% | 6.7% |
| Lung | 9.2% | 4.1% | 8.5% |
| All other cancers | 2.7% | 3.7% | 5.3% |
*Suppressed owing to small numbers.
Data source: Provincial cancer agencies and programs
Topic: Optimizing care at end of life
Title of image: Percentage of type of systemic therapy received by patients with cancer who died and received an IV or subcutaneous cancer drug treatment within 14 days of death
Caveats/limitations:
- Data for combined ‘chemotherapy and immunotherapy’ treatment was only collected for 2021.
- The COVID-19 pandemic may have affected service provision.
Note: Data for ‘chemotherapy and immunotherapy’ is presented in the accompanying data table.
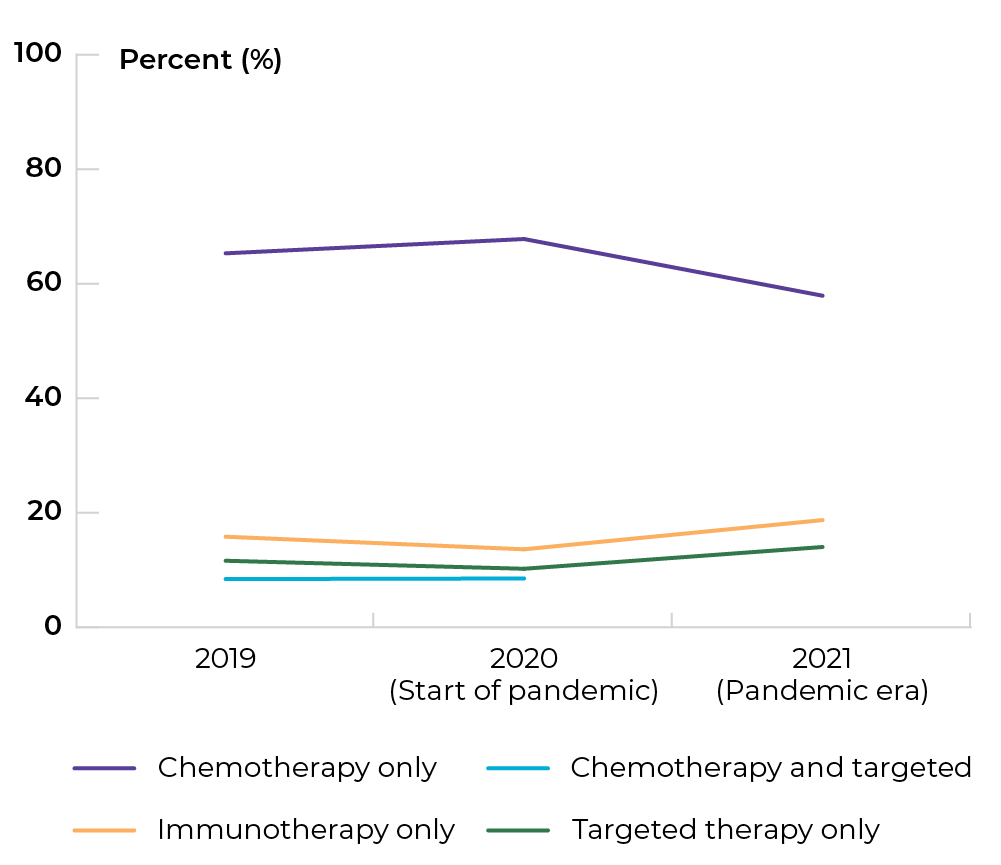
Title of table: Percentage of type of systemic therapy received by patients with cancer who died and received an IV or subcutaneous cancer drug treatment within 14 days of death
| Treatment | 2019 | 2020 (Start of pandemic) | 2021 (Pandemic era) |
|---|---|---|---|
| Chemotherapy only | 65.3% | 67.8% | 57.9% |
| Chemotherapy and immunotherapy | – | – | 5.6% |
| Chemotherapy and targeted | 8.4% | 8.5% | * |
| Immunotherapy only | 15.8% | 13.6% | 18.7% |
| Targeted therapy only | 11.6% | 10.2% | 14.0% |
*Suppressed owing to small numbers.
– Data not available.
Data source: Provincial cancer agencies and programs
Topic: Optimizing screening and appropriate follow-up
Title of image: Percentage of people with a cervix in SK aged 18-24 who received a Pap test
Caveats/limitations: The COVID-19 pandemic may have affected service provision.
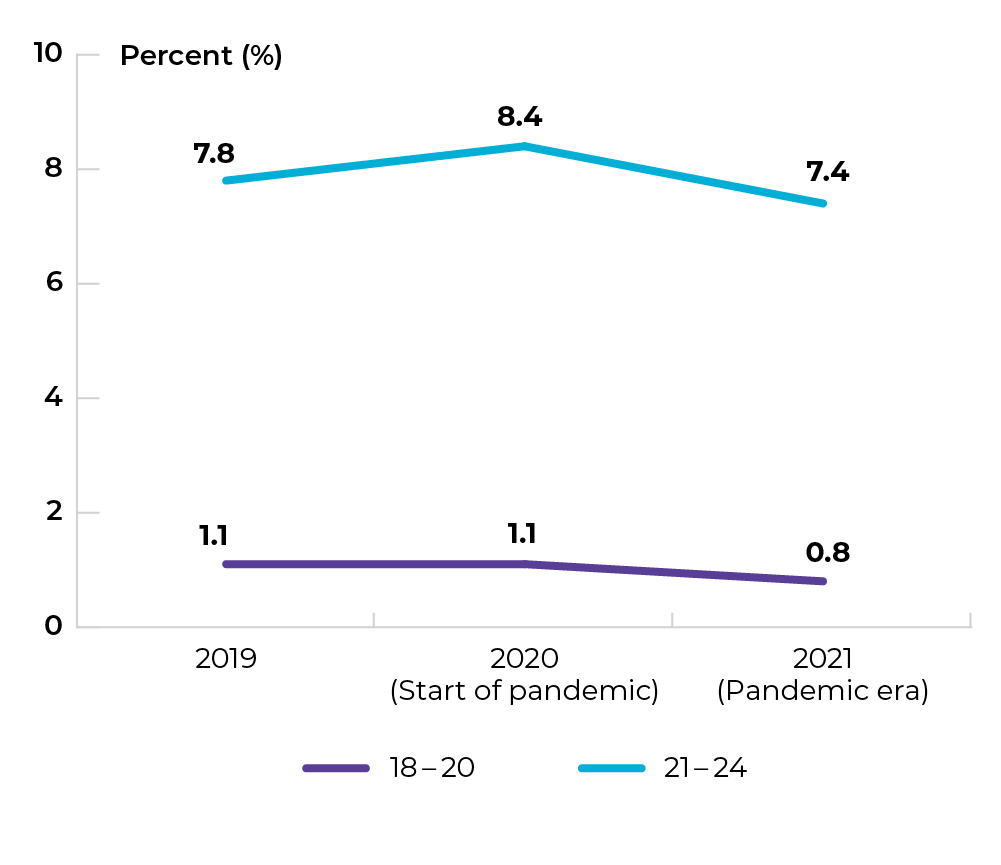
Data source: Provincial cancer agencies and programs
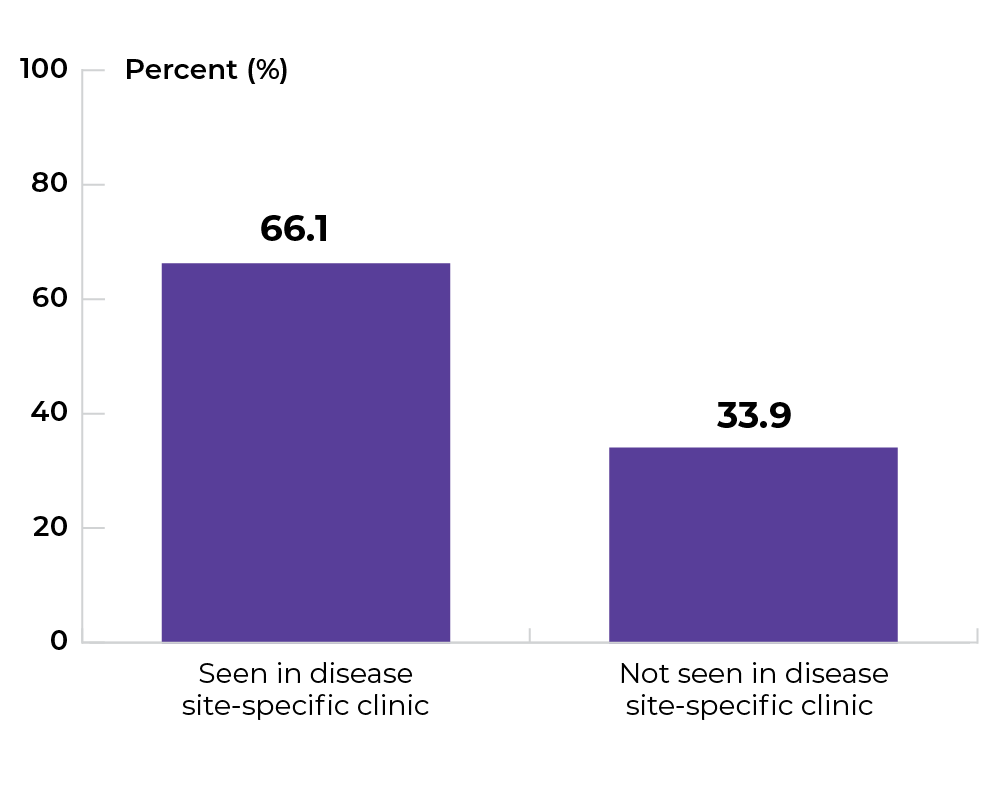
Priority 3 Action 3: Design and implement new models of care
Topic: Expanding models of care
Title of image: Percentage of eligible patients seen in a disease site specific clinic at the Saskatchewan Cancer Agency in 2022
Caveats/limitations:
- Eligible patient is defined as a patient with cancer in a disease site for which there is a disease site-specific clinic.
- The COVID-19 pandemic may have affected service provision.
Data source: Provincial cancer agencies and programs
Priority 4 Action 1: Provide better services and care adapted to the specific needs of underserved groups
Topic: Increasing access to culturally safe care
Title of image: Percentage of patients who felt their care providers treated them with dignity and respect.
Data source: AOPSS Survey (2016)
Topic: Increasing support to help patients navigate the system
Title of image: Percentage of new cancer patients who were referred to patient navigator services
Caveats/limitations:
- Due to various access points and timelines related to varying levels of urgency, not all patients are appropriate for New Patient Navigation services (i.e. those diagnosed in hospital or urgent/emergent new patient consultations).
- The COVID-19 pandemic may have affected service provision.
 Data source: Provincial cancer agencies and programs
Topic: Increasing support to help patients navigate the system
Title of image: Percentage of new cancer patients who were referred to patient navigator services, by location
Caveats/limitations:
- Due to various access points and timelines related to varying levels of urgency, not all patients are appropriate for New Patient Navigation services (i.e. those diagnosed in hospital or urgent/emergent new patient consultations.)
- The COVID-19 pandemic may have affected service provision.
Data source: Provincial cancer agencies and programs
Topic: Increasing support to help patients navigate the system
Title of image: Percentage of new cancer patients who were referred to patient navigator services, by income quintile
Caveats/limitations:
- Income quintiles are defined as Neighborhood income quintile before tax for patients who live in Saskatoon and Regina. Patients who live outside of Saskatoon and Regina are not included, as neighborhood income quintiles are less representative in rural areas.
- Due to various access points and timelines related to varying levels of urgency, not all patients are appropriate for New Patient Navigation services (i.e. those diagnosed in hospital or urgent/emergent new patient consultations.
- The COVID-19 pandemic may have affected service provision.
 Data source: Provincial cancer agencies and programs
Priority 4 Action 2: Ensure rural and remote communities have the resources required to better serve their people
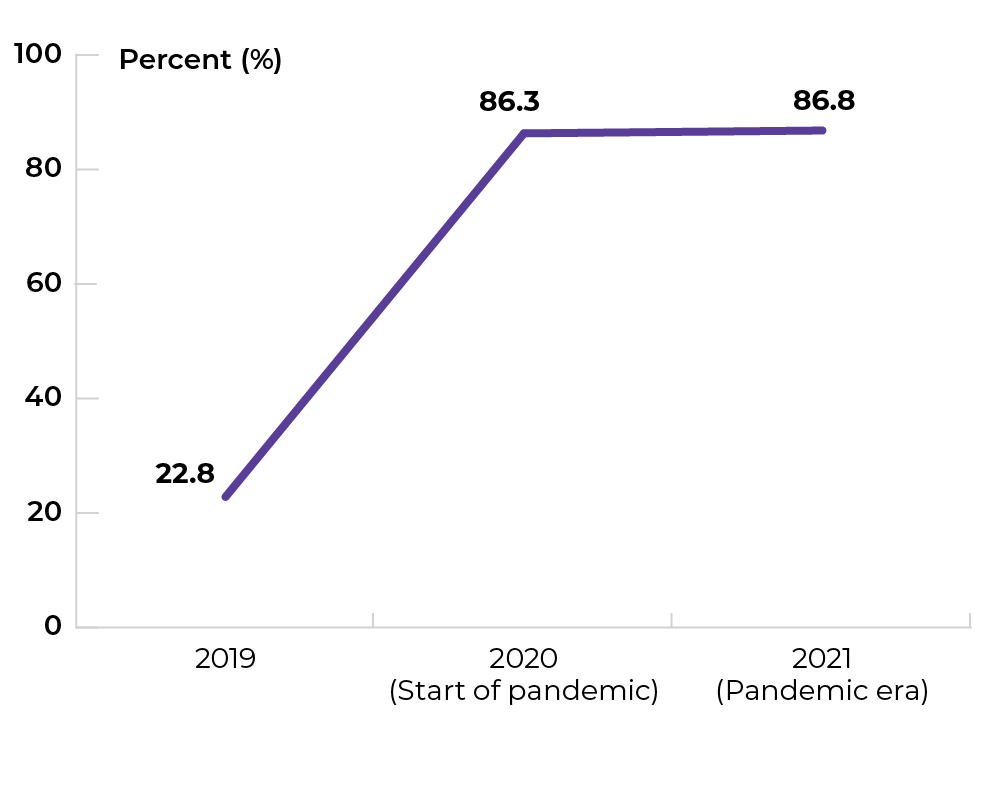
Topic: Increasing access to virtual care
Title of image: Percentage of cancer patients from rural/remote communities using virtual health appointment for physician-led appointments
Caveats/limitations:
- Note that appointment modality is not mutually exclusive. Patients may access more than one virtual service at a time
- The COVID-19 pandemic may have affected service provision.
 Data source: Provincial cancer agencies and programs
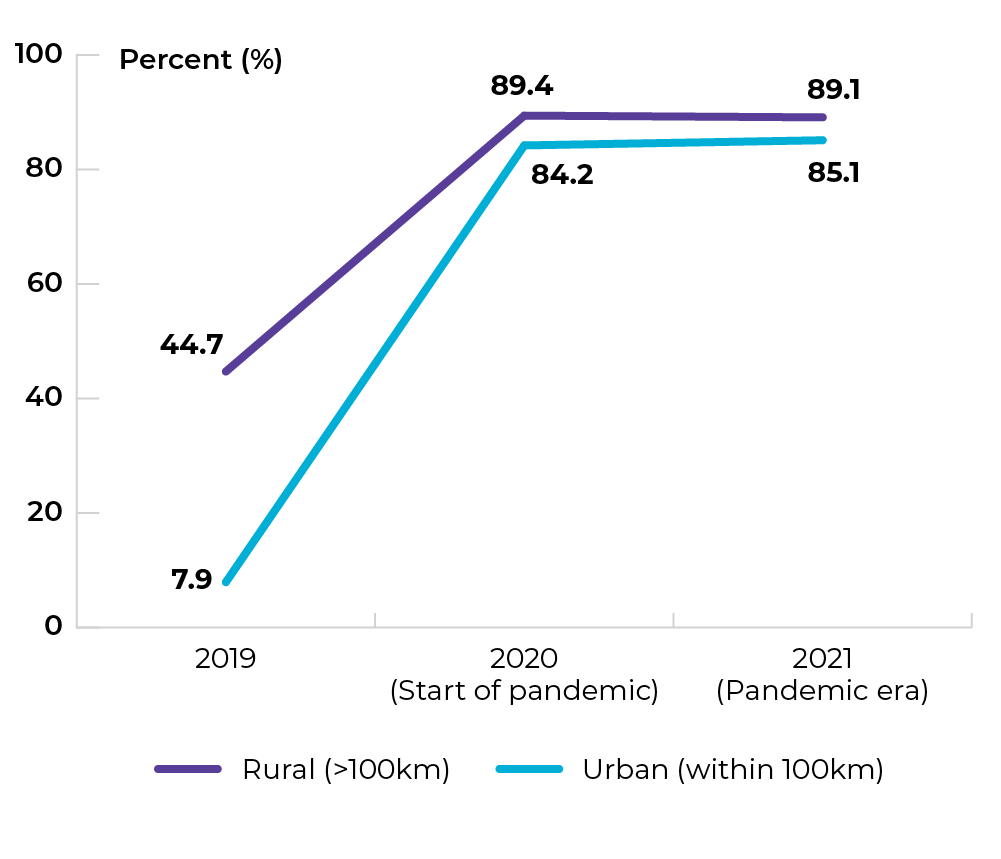
Topic: Increasing access to virtual care
Title of image: Percentage of cancer patients using virtual health appointment for physician-led appointments, by location
Caveats/limitations:
- Rural is defined at more than 100km outside of Regina and Saskatoon and urban is defined as within 100km of Regina or Saskatoon.
- The COVID-19 pandemic may have affected service provision.
Data source: Provincial cancer agencies and programs
Topic: Increasing access to virtual care
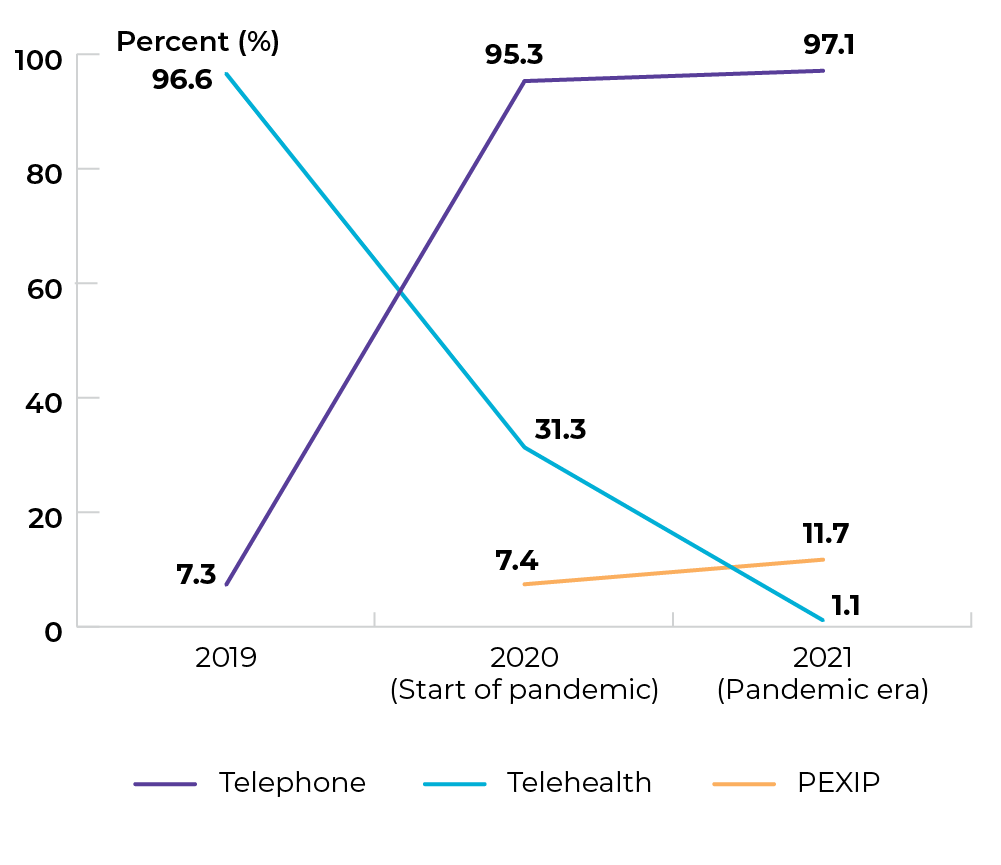
Title of image: Percentage of cancer patients who had a virtual health appointment, by appointment modality
Caveats/limitations:
- Note that appointment modality is not mutually exclusive. A patient could have had a telephone, telehealth and/or PEXIP video appointment in the time period of interest.
- The COVID-19 pandemic may have affected service provision.
Data source: Provincial cancer agencies and programs
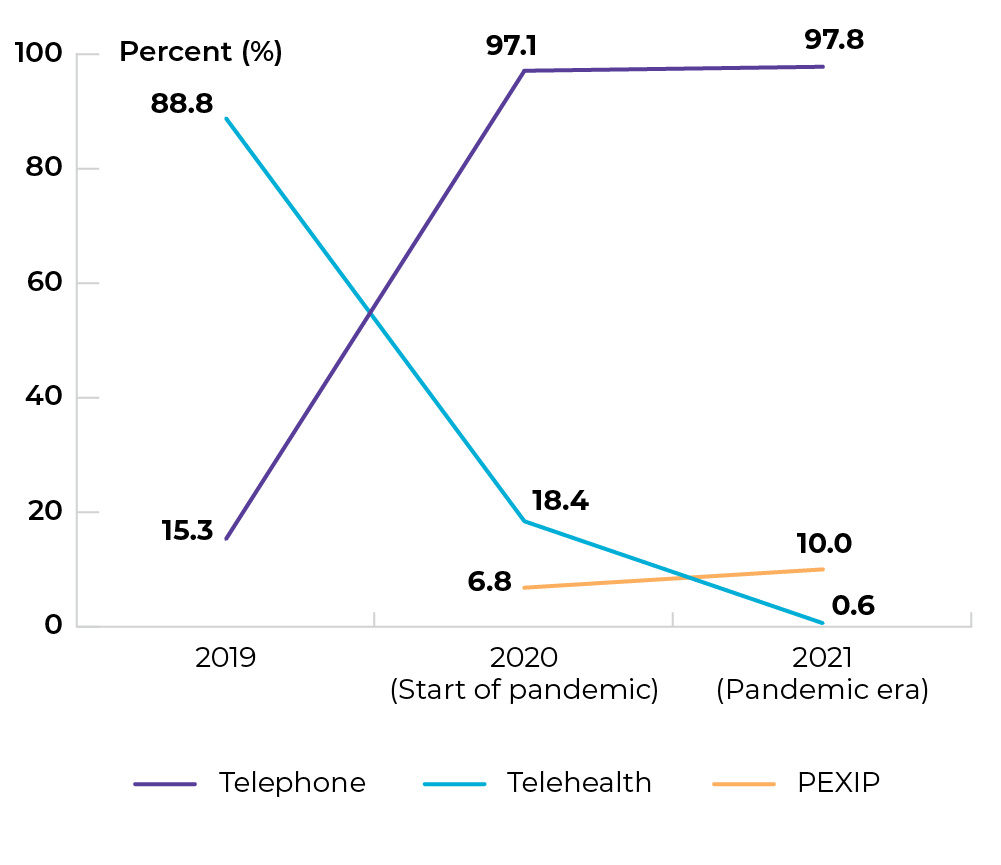
Topic: Increasing access to virtual care
Title of image: Percentage of cancer patients from urban centres who had a virtual health appointment, by appointment type
Caveats/limitations:
- Note that appointment modality is not mutually exclusive. A patient could have had a telephone, telehealth and/or PEXIP video appointment in the time period of interest.
- The COVID-19 pandemic may have affected service provision.
Data source: Provincial cancer agencies and programs
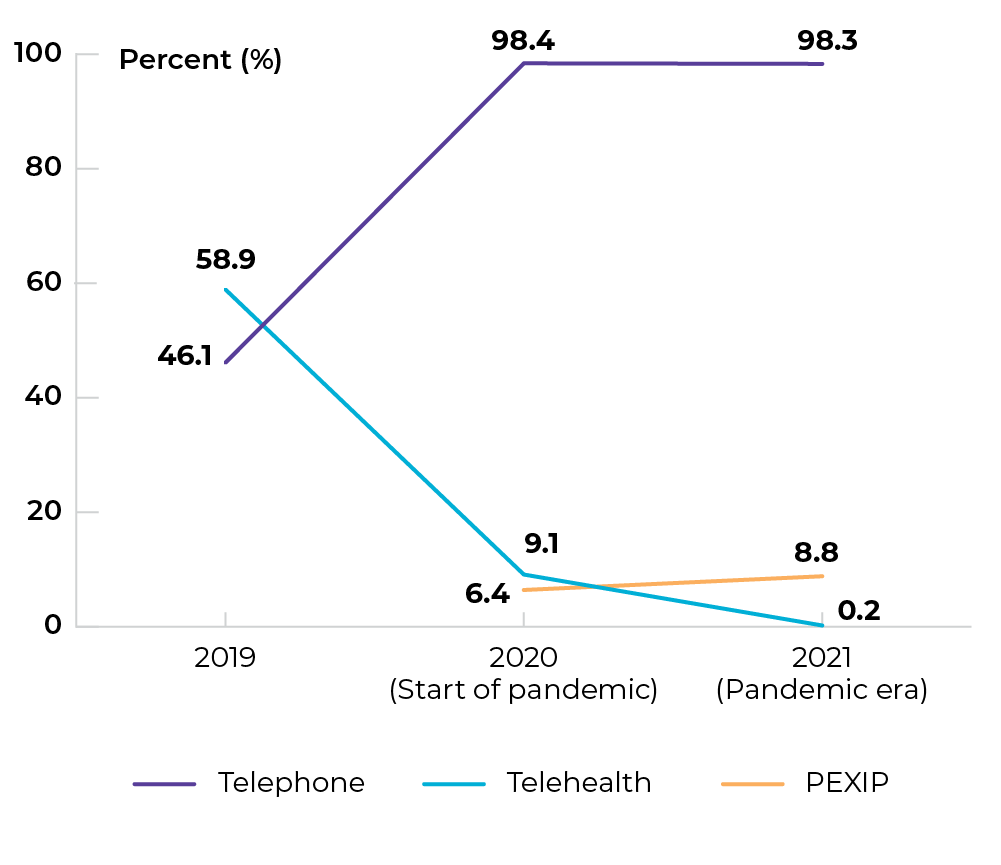
Topic: Increasing access to virtual care
Title of image: Percentage of cancer patients from rural communities who had a virtual health appointment, by appointment type
Caveats/limitations:
- Note that appointment modality is not mutually exclusive. A patient could have had a telephone, telehealth and/or PEXIP video appointment in the time period of interest.
- The COVID-19 pandemic may have affected service provision.
Data source: Provincial cancer agencies and programs
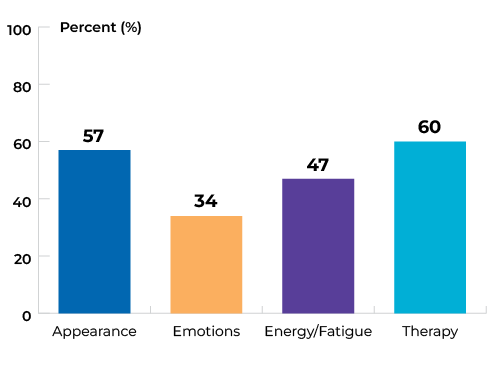
Topic: Increasing access to supportive care services
Title of image: Percentage of patients in SK seen at the SCA accessing supportive care services
Caveats/limitations: The COVID-19 pandemic may have affected service provision.
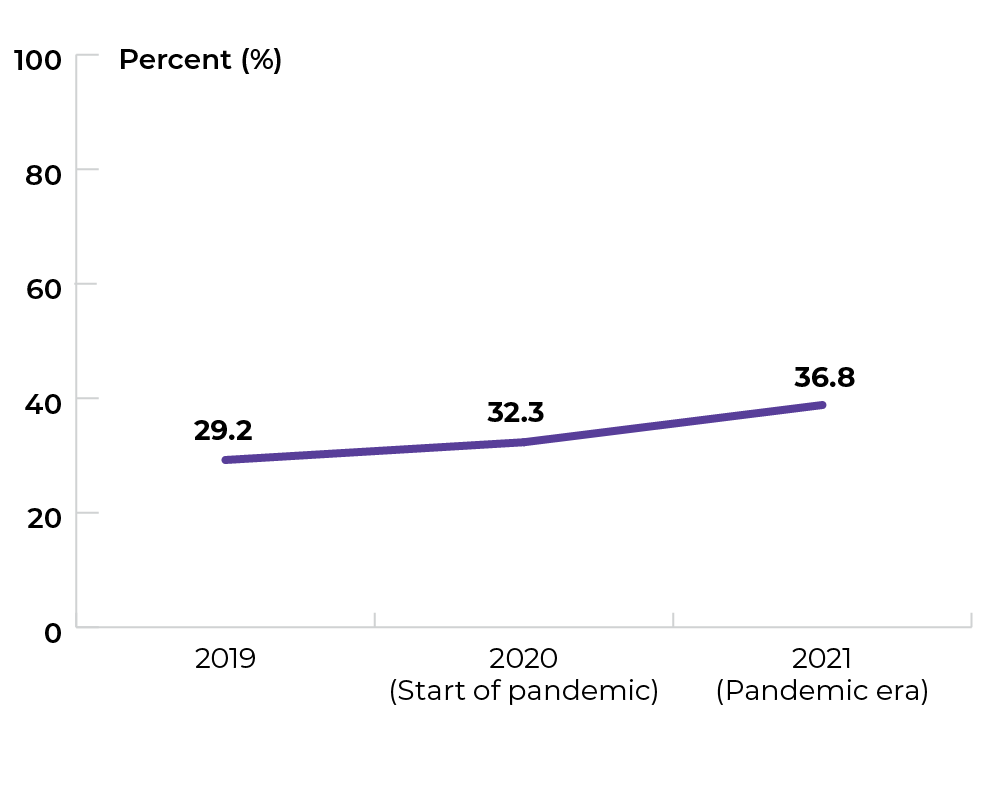
Data source: Provincial cancer agencies and programs
Topic: Increasing access to supportive care services
Title of image: Percentage of patients in SK seen at the SCA accessing supportive care services, by appointment type
Caveats/limitations: The COVID-19 pandemic may have affected service provision.
Note: SMPCOC = Symptom Management & Palliative Outpatient Clinic
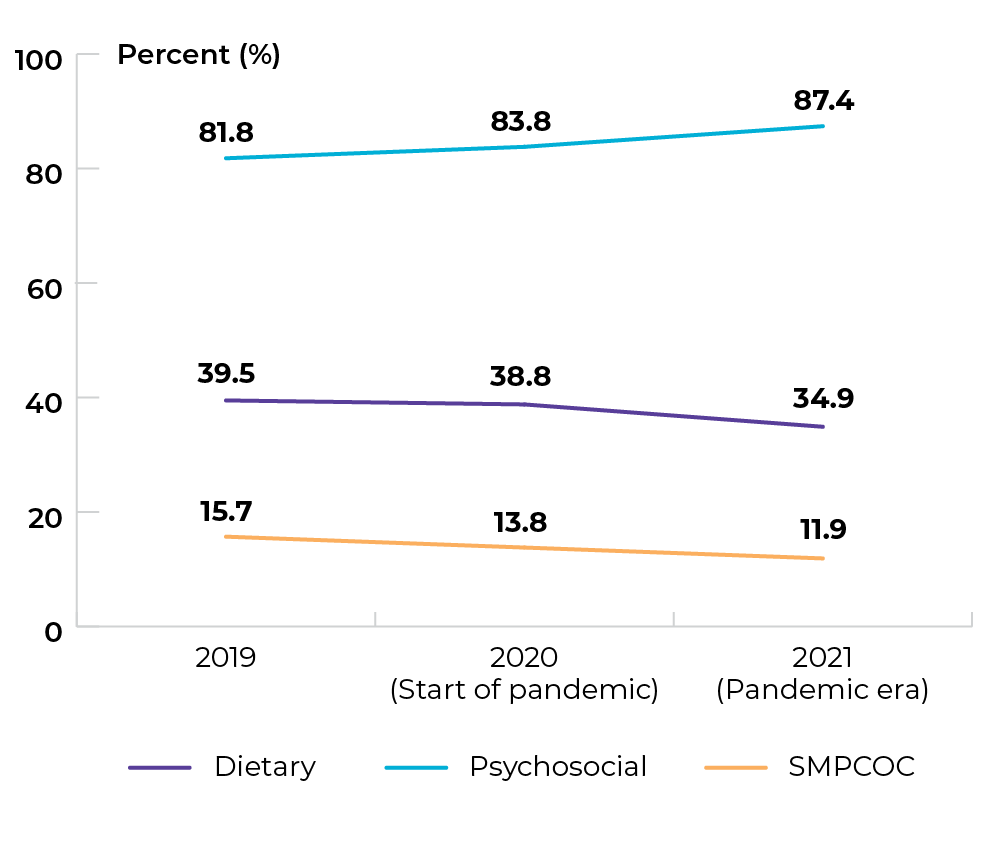
Data source: Provincial cancer agencies and programs
Topic: Increasing access to supportive care services
Title of image: Percentage of patients in SK seen at the SCA accessing supportive care services, by appointment modality
Caveats/limitations:
- A virtual appointment could include phone and/or telehealth appointments (in 2019) and phone, telehealth and/or PEXIP video appointments (in 2020-21).
- Approximately 50% of the Saskatchewan population lives in Saskatoon and Regina (urban) and 50% live outside Saskatoon and Regina (rural).
- The COVID-19 pandemic may have affected service provision.
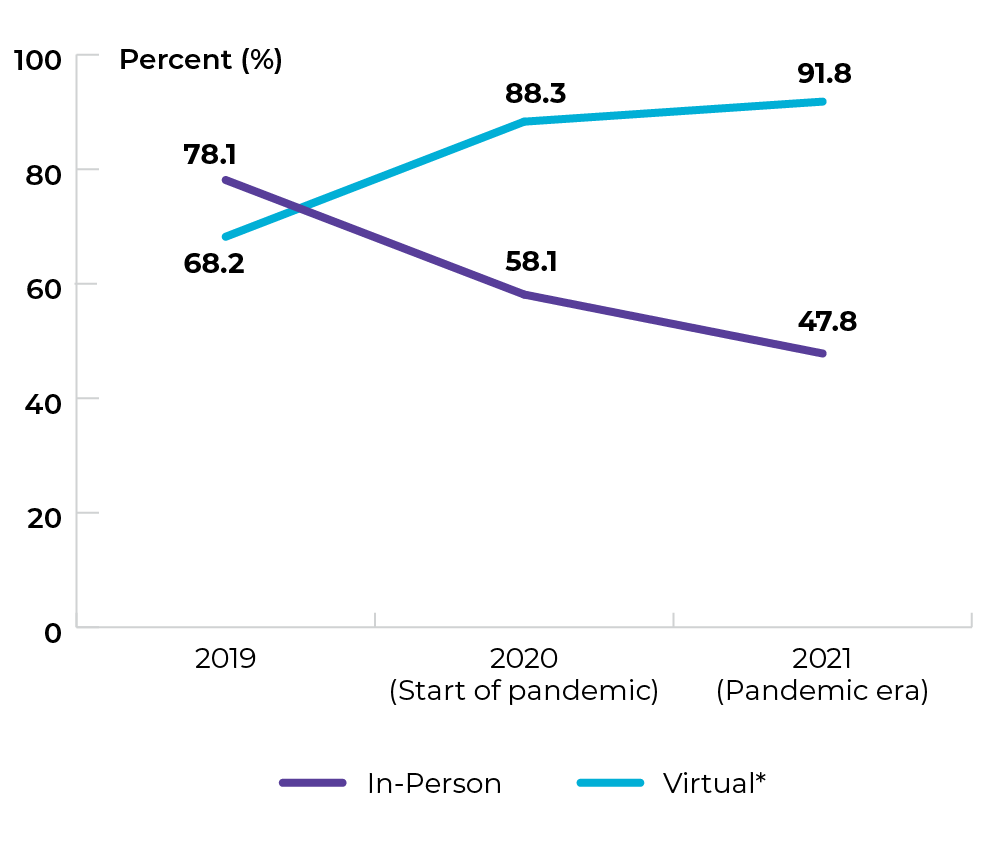
*Virtual services include phone, telehealth, and PEXIP video appointments for 2020 and 2021, and phone and telehealth for 2019. Patients may access more than one virtual service at a time, therefore the total percentage may be over-estimated.
Topic: Increasing access to supportive care services
Title of image: Percentage of patients seen at the SCA accessing supportive care services, by age group
Caveats/limitations: The COVID-19 pandemic may have affected service provision.
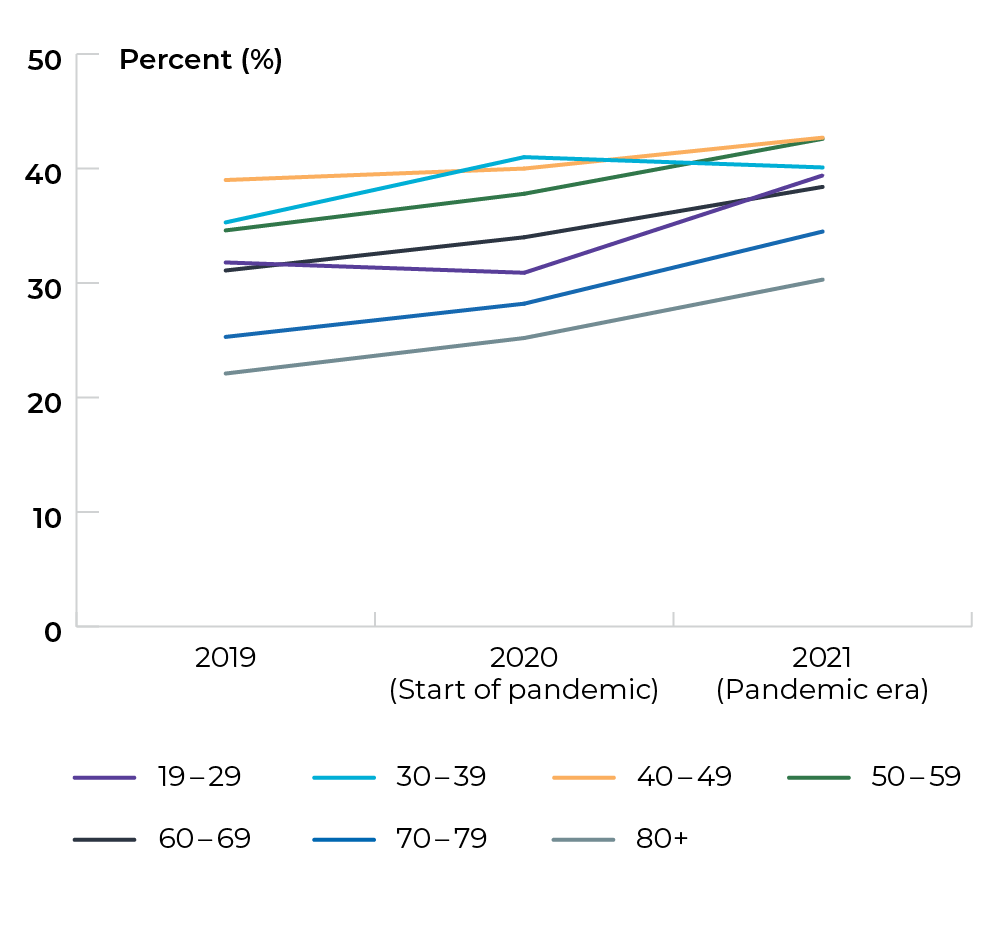
Title of table: Percentage of patients seen at the SCA accessing supportive care services, by age group
| Age group | 2019 | 2020 (Start of pandemic) | 2021 (Pandemic era) |
|---|---|---|---|
| 19-29 | 31.8% | 30.9% | 39.4% |
| 30-39 | 35.3% | 41.0% | 40.1% |
| 40-49 | 39.0% | 40.0% | 42.7% |
| 50-59 | 34.6% | 37.8% | 42.6% |
| 60-69 | 31.1% | 34.0% | 38.4% |
| 70-79 | 25.3% | 28.2% | 34.5% |
| 80+ | 22.1% | 25.2% | 30.3% |
Data source: Provincial cancer agencies and programs
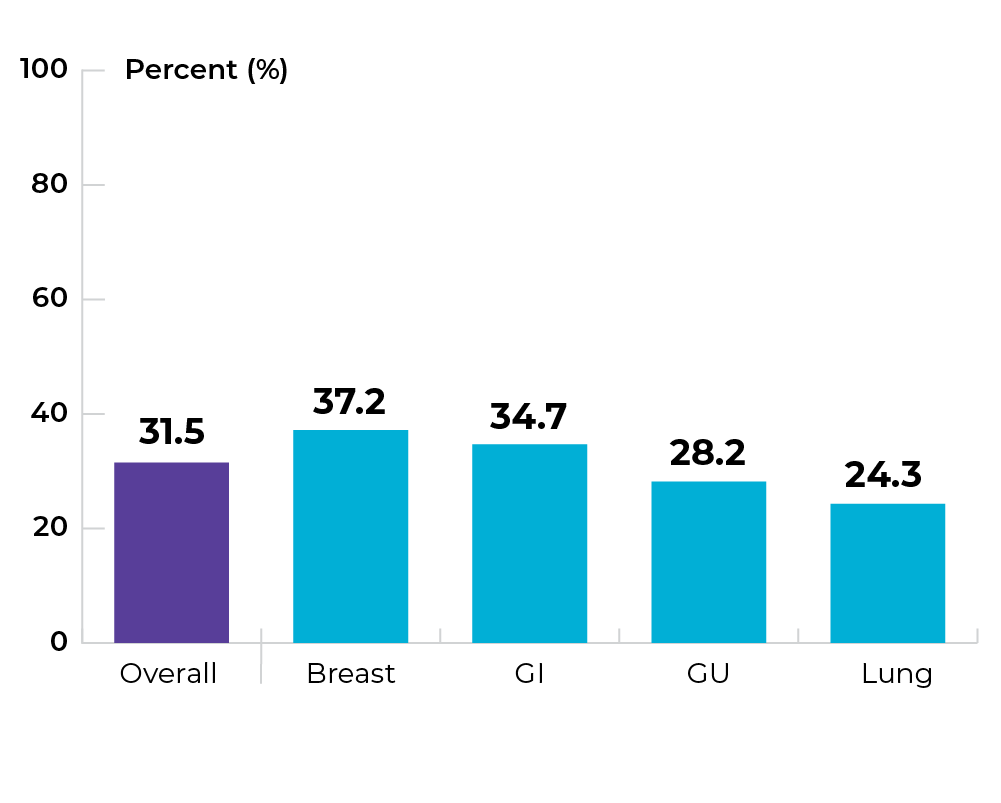
Topic: Increasing access to supportive care services
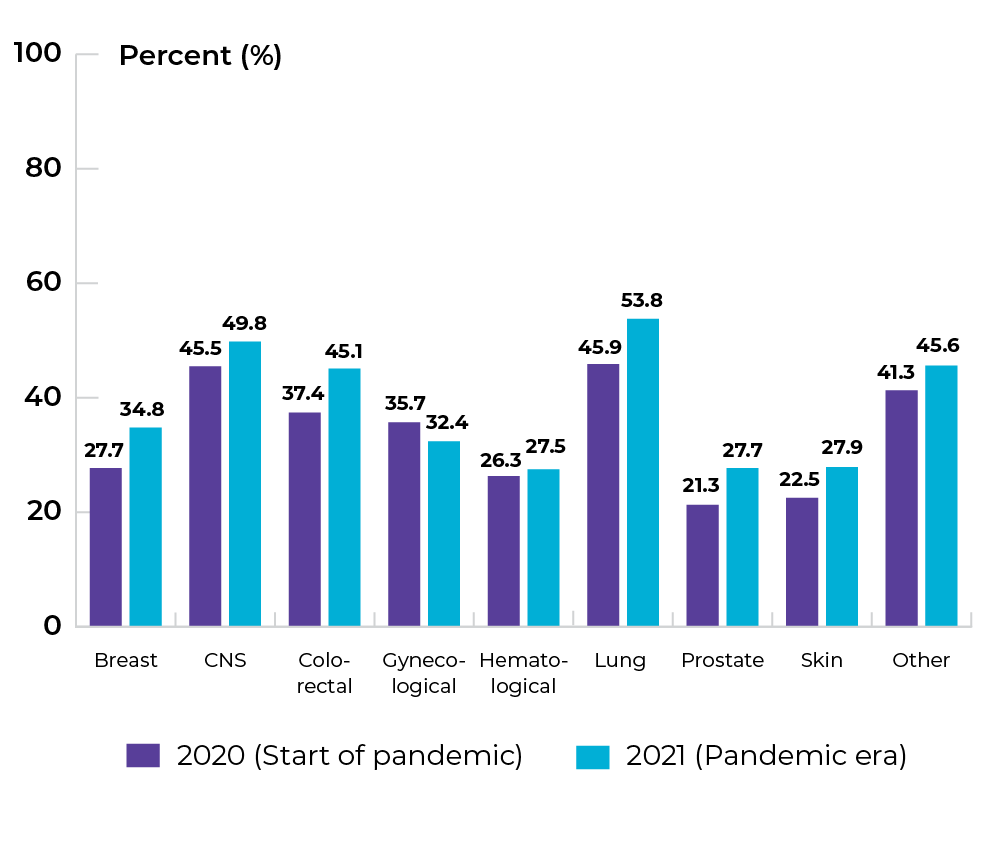
Title of image: Percentage of patients seen at the SCA accessing supportive care services, by diagnosis
Caveats/limitations: The COVID-19 pandemic may have affected service provision.
 Data source: Provincial cancer agencies and programs
Topic: Increasing access to supportive care services
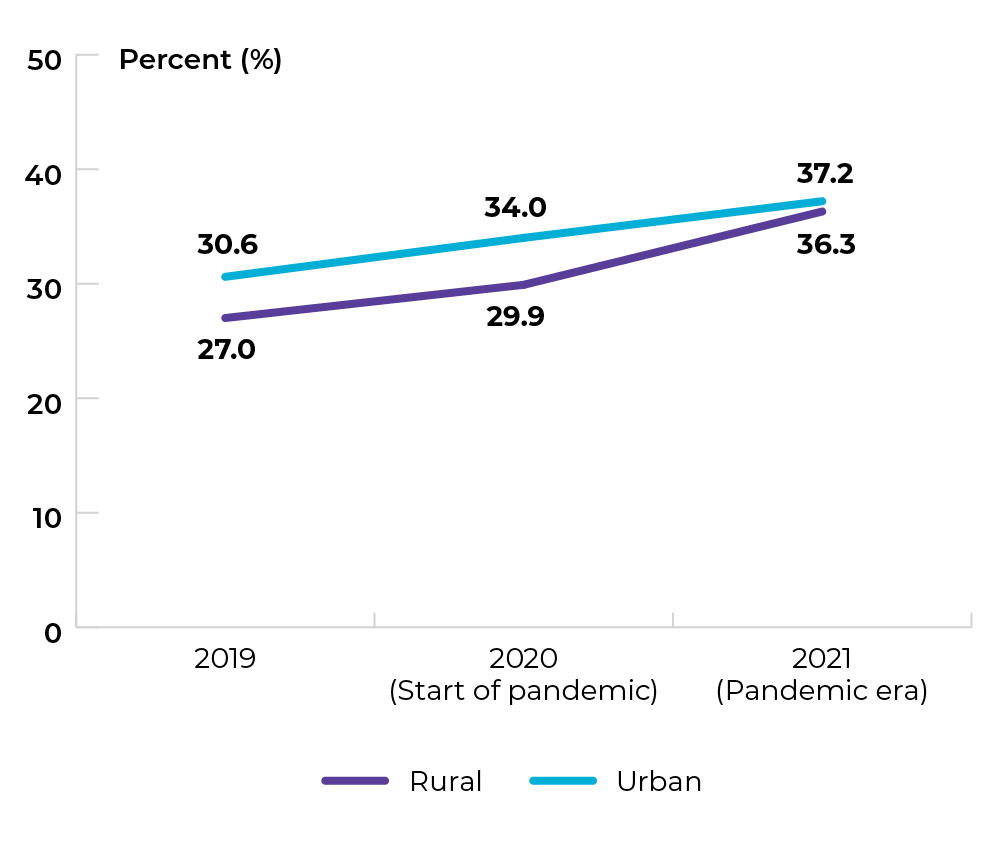
Title of image: Percentage of patients seen at the SCA accessing supportive care services, by location
Caveats/limitations:
- The COVID-19 pandemic may have affected service provision.
- Rural is defined at 100km outside of Regina and Saskatoon and urban is defined as within 100km of Regina or Saskatoon.
 Data source: Provincial cancer agencies and programs
Priority 4 Action 3: Ensure care can be delivered between provinces, territories and federal jurisdictions when needed
Topic: Improving access to timely care for people who need to travel between jurisdictions
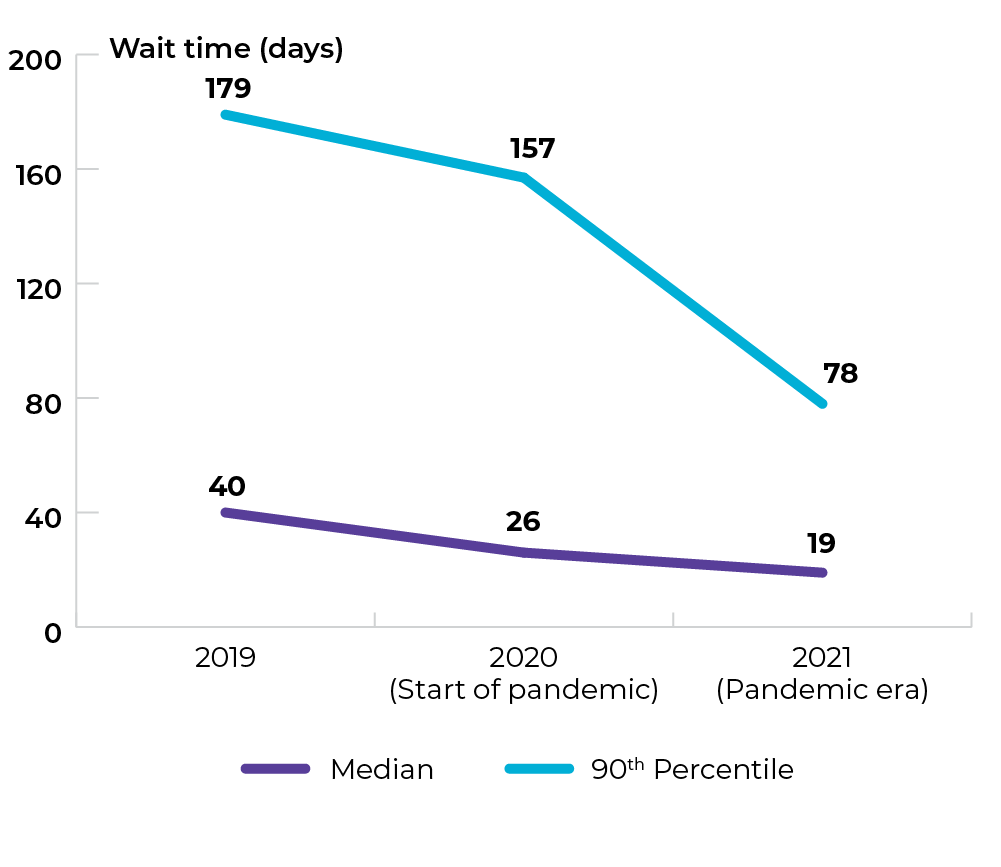
Title of image: Average wait time (in days) for patients with cancer who require cancer treatment outside of their home jurisdiction
Caveats/limitations:
- If the patient was approved for multiple treatments, the wait time was based on approval to first treatment.
- Wait times for patients requiring procedure or treatment outside the province may require measurement of the timelines at different levels. These may include from request of procedure or treatment to approval from SCA, time of approval by the ministry, appointment for procedure or treatment by the facility outside the province. These may have to be taken in account when considering treatment or procedure which could be done within the province.
- The COVID-19 pandemic may have affected service provision.
 Data source: Provincial cancer agencies and programs
Priority 5 Action 1: Integrate the full spectrum of information and support services to ensure people are fully supported throughout the cancer experience
Topic: Improving availability of information and support
Title of image: Percentage of cancer patients who reported that they were given enough information about their cancer therapy and potential impacts of their cancer and/or treatment
Caveats/limitations: The COVID-19 pandemic may have affected service provision.
Data source: AOPSS Survey (2016)
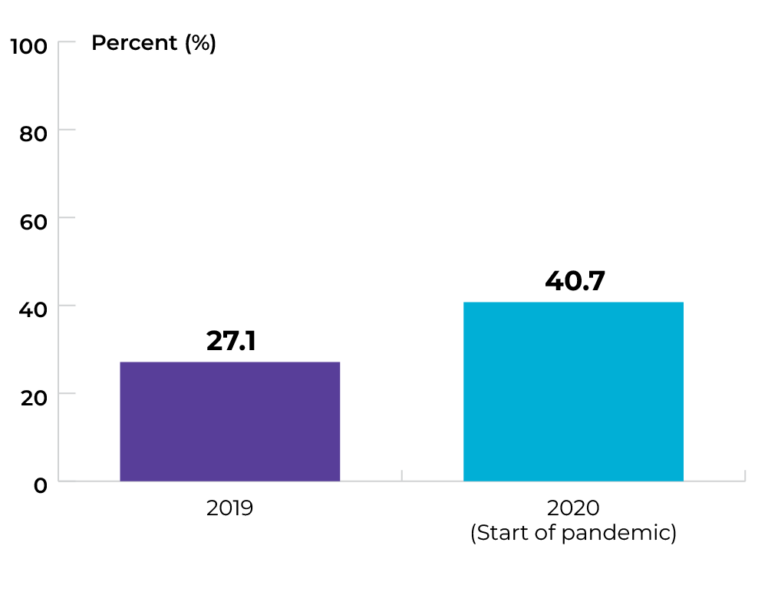
Topic: Improving access to shared medical records
Title of image: Percentage of healthcare professionals with direct access to cancer patient information
Caveats/limitations: The COVID-19 pandemic may have affected service provision.
Data source: Provincial cancer agencies and programs
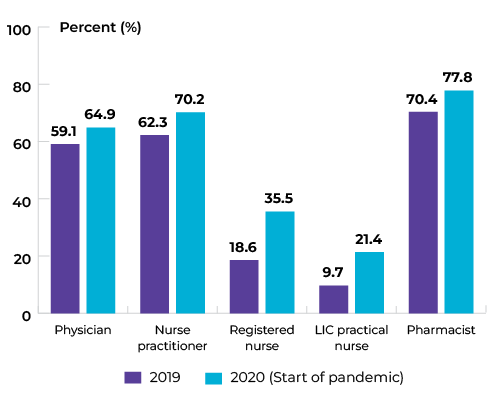
Topic: Improving access to shared medical records
Title of image: Percentage of healthcare professionals with direct access to cancer patient information, by healthcare professional
Caveats/limitations: The COVID-19 pandemic may have affected service provision.
Data source: Provincial cancer agencies and programs
Priority 5 Action 2: Address the limited and unequal access to palliative and end-of-life care across Canada
Topic: Improving access to quality end-of-life care
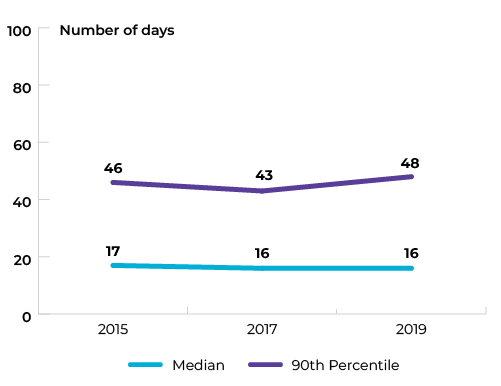
Title of image: Cumulative length of stay for cancer patients (overall) who were in or admitted to an acute care hospital 30 days prior to death across SK for fiscal years 2015, 2017, and 2019
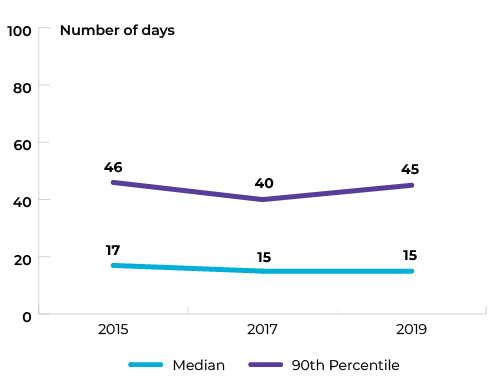 Data source: Canadian Institute for Health Information (CIHI), Discharge Abstract Database (DAD)
Topic: Improving access to quality end-of-life care
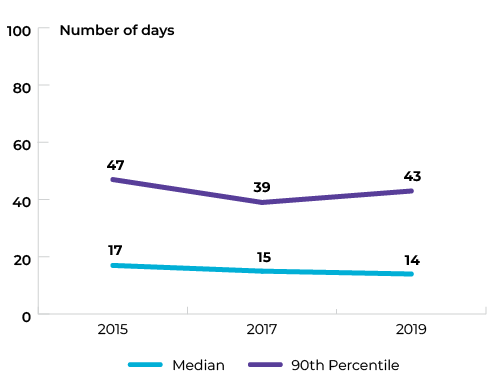
Title of image: Cumulative length of stay for cancer patients (rural/remote) who were in or admitted to an acute care hospital 30 days prior to death across SK for fiscal years 2015, 2017, and 2019
 Data source: Canadian Institute for Health Information (CIHI), Discharge Abstract Database (DAD)
Topic: Improving access to quality end-of-life care
Title of image: Cumulative length of stay for cancer patients (urban) who were in or admitted to an acute care hospital 30 days prior to death across SK for fiscal years 2015, 2017, and 2019
 Data source: Canadian Institute for Health Information (CIHI), Discharge Abstract Database (DAD)
The data tables and technical appendix for all indicators are available upon request at info@partnershipagainstcancer.ca. You will receive a response in two to three business days.