Supplementary data: British Columbia
This page provides data visualizations related to the priorities for Canada’s cancer system.
The data tables and technical appendix for all indicators are available upon request at info@partnershipagainstcancer.ca.
Priority 1 Action 1: Help people to stop smoking or not start in the first place and live healthier lives
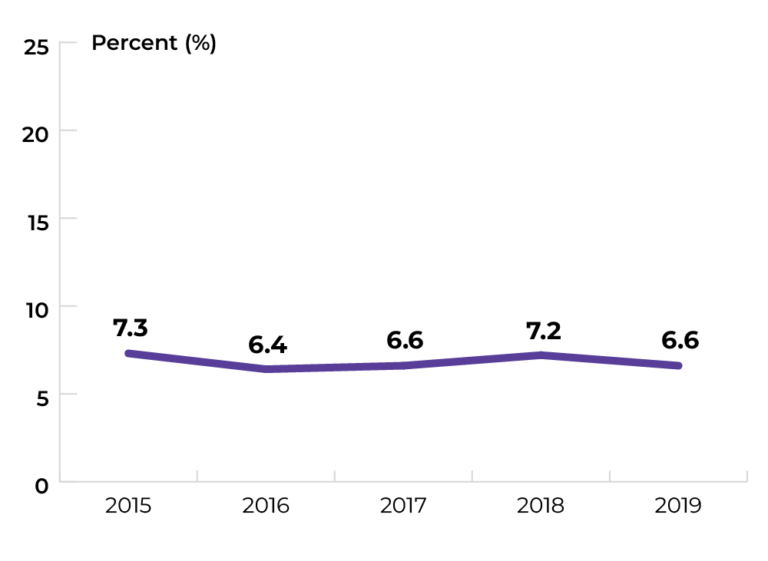
Topic: Keeping people smoke-free
Title of image: Percentage of individuals (aged ≥ 12) classified as daily or occasional smokers.
Caveats/limitations: The COVID-19 pandemic had major impacts on the data collection operations and response rates for this survey.
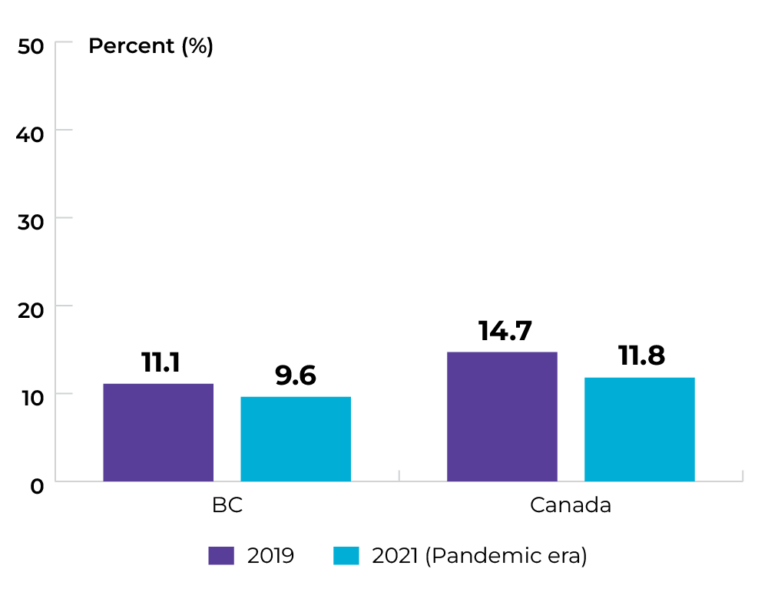
Data source: Canadian Community Health Survey
Topic: Keeping people smoke-free
Title of image: Percentage of males in BC (aged ≥ 18) classified as daily or occasional smokers by household income quintile
Caveats/limitations: The COVID-19 pandemic had major impacts on the data collection operations and response rates for this survey.
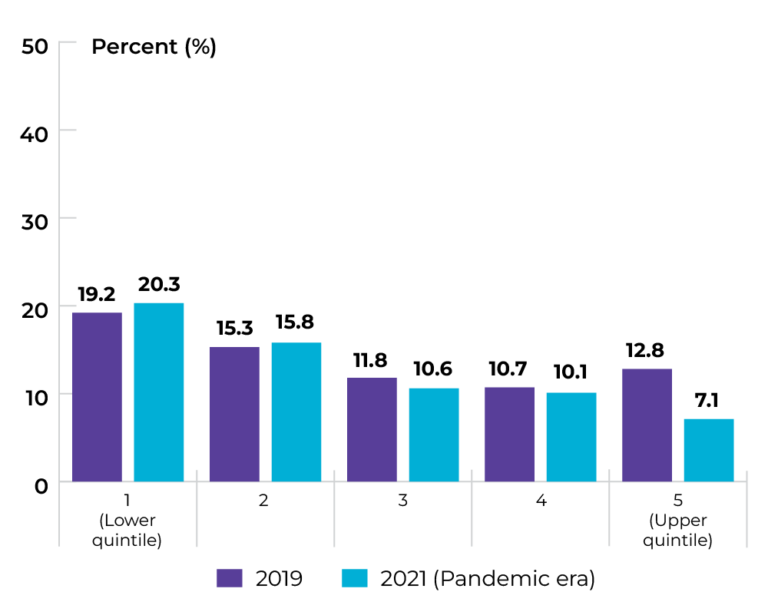
Data source: Canadian Community Health Survey
Topic: Keeping people smoke-free
Title of image: Percentage of females in BC (aged ≥ 18) classified as daily or occasional smokers by household income quintile
Caveats/limitations: The COVID-19 pandemic had major impacts on the data collection operations and response rates for this survey.
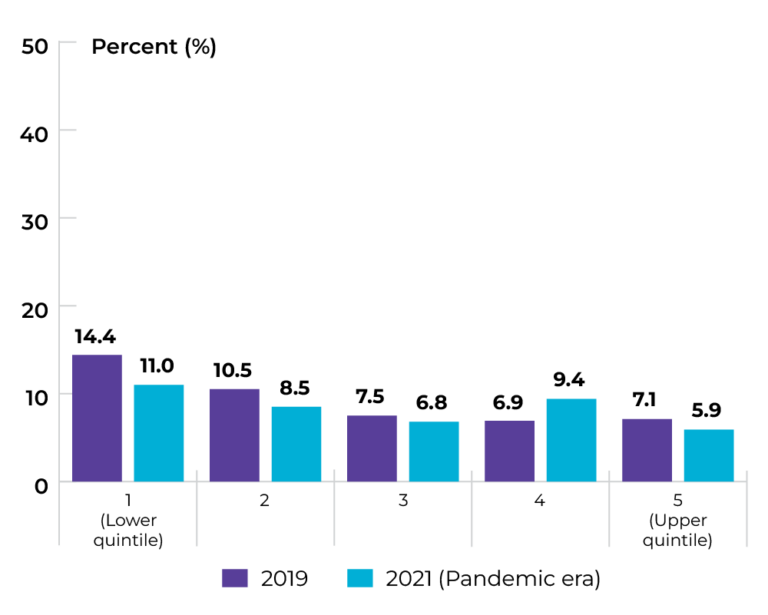
Data source: Canadian Community Health Survey
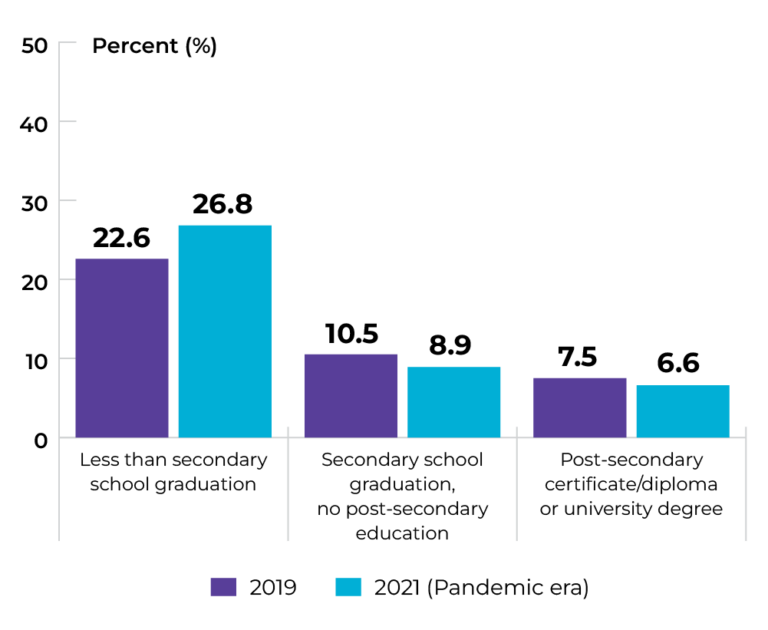
Topic: Keeping people smoke-free
Title of image: Percentage of males in BC (aged ≥ 18) classified as daily or occasional smokers in 2019, by highest level of education
Caveats/limitations: The COVID-19 pandemic had major impacts on the data collection operations and response rates for this survey.
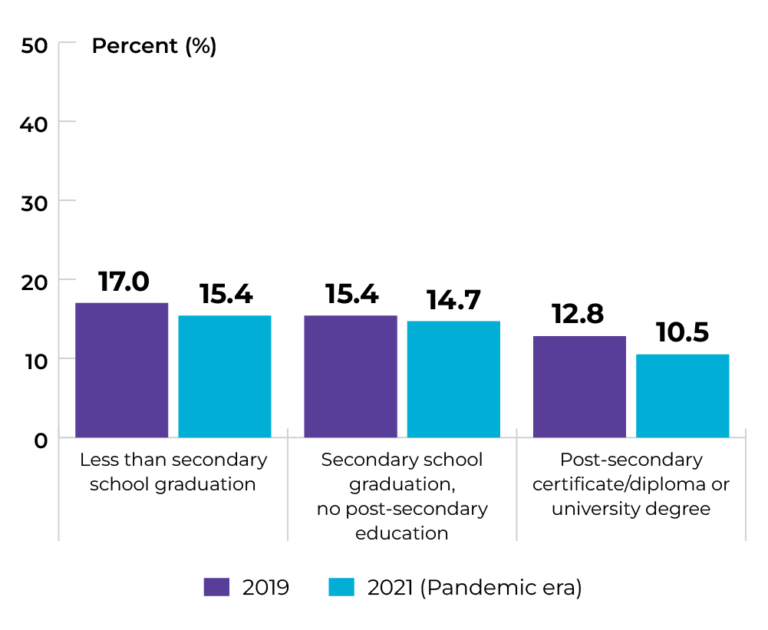
Data source: Canadian Community Health Survey
Topic: Keeping people smoke-free
Title of image: Percentage of females in BC (aged ≥ 18) classified as daily or occasional smokers in 2019, by highest level of education
Caveats/limitations: The COVID-19 pandemic had major impacts on the data collection operations and response rates for this survey.
Data source: Canadian Community Health Survey
Topic: Maintaining healthy body weight
Title of image: Percentage of people living with obesity or overweight (aged ≥ 18)
Caveats/limitations:
- While healthy living is an important goal for all British Columbians, it is important to note that other factors (i.e., social determinants of health) might prevent access to healthy food and safe public spaces to be active, and these factors are not evenly distributed across the population.
- The COVID-19 pandemic had major impacts on the data collection operations and response rates for this survey.
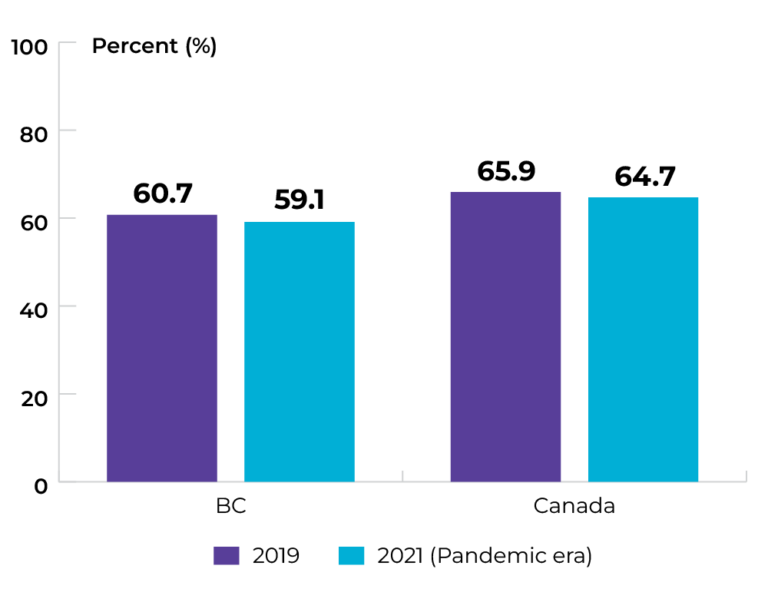
Data source: Canadian Community Health Survey
Topic: Maintaining healthy body weight
Title of image: Percentage of people living with obesity or overweight in BC (aged ≥ 18), by sex
Caveats/limitations:
- While healthy living is an important goal for all British Columbians, it is important to note that other factors (i.e., social determinants of health) might prevent access to healthy food and safe public spaces to be active, and these factors are not evenly distributed across the population.
- The COVID-19 pandemic had major impacts on the data collection operations and response rates for this survey.

Data source: Canadian Community Health Survey
Topic: Maintaining healthy body weight
Title of image: Percentage of males living with obesity or overweight in BC (aged ≥ 18) by income quintile and sex
Caveats/limitations:
- While healthy living is an important goal for all British Columbians, it is important to note that other factors (i.e., social determinants of health) might prevent access to healthy food and safe public spaces to be active, and these factors are not evenly distributed across the population.
- The COVID-19 pandemic had major impacts on the data collection operations and response rates for this survey.
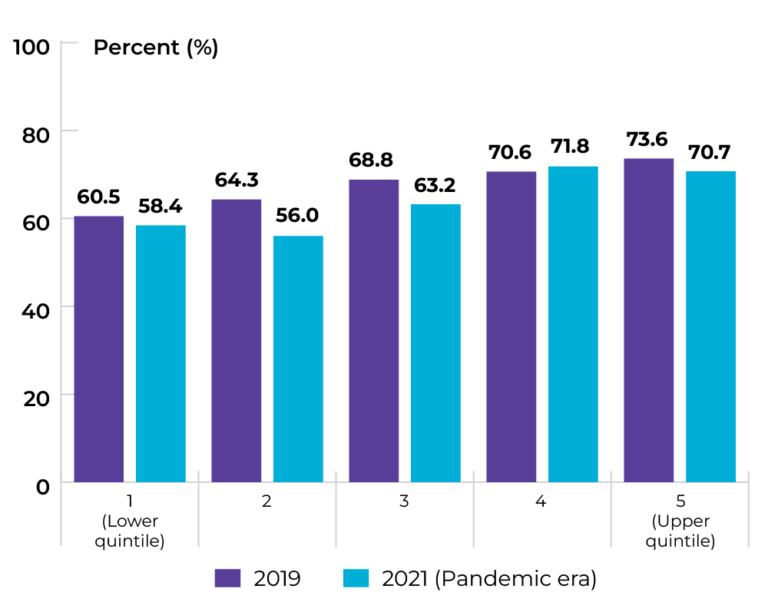
Data source: Canadian Community Health Survey
Topic: Maintaining healthy body weight
Title of image: Percentage of females living with obesity or overweight in BC (aged ≥ 18) by income quintile and sex
Caveats/limitations:
- While healthy living is an important goal for all British Columbians, it is important to note that other factors (i.e., social determinants of health) might prevent access to healthy food and safe public spaces to be active, and these factors are not evenly distributed across the population.
- The COVID-19 pandemic had major impacts on the data collection operations and response rates for this survey.
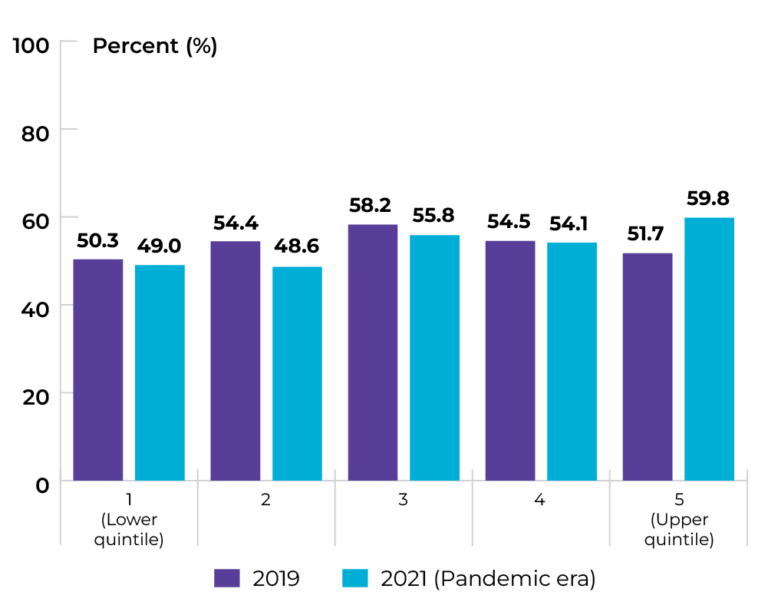
Data source: Canadian Community Health Survey
Priority 1 Action 2: Adopt proven practices known to reduce the risk of cancer
Topic: Increasing HPV vaccination
Title of image: Percentage of Grade 6 students who received two doses of HPV vaccination, by sex.
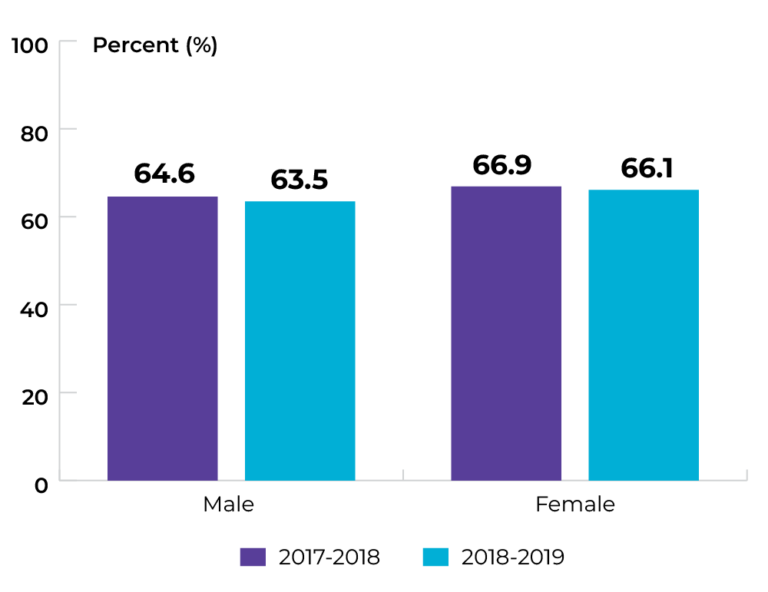
Data source: Provincial cancer agencies and programs
Topic: Increasing genetic testing
Title of image: Percentage of patients diagnosed with breast, colorectal and ovarian cancers who were referred for and received genetic testing results within 6 months of diagnosis
Caveats/limitations:
- Wait-times reflect waits for those patients diagnosed and referred for testing. Patients who have diagnoses but that are not referred for testing are not captured within these statistics.
- The COVID-19 pandemic may have affected service provision.
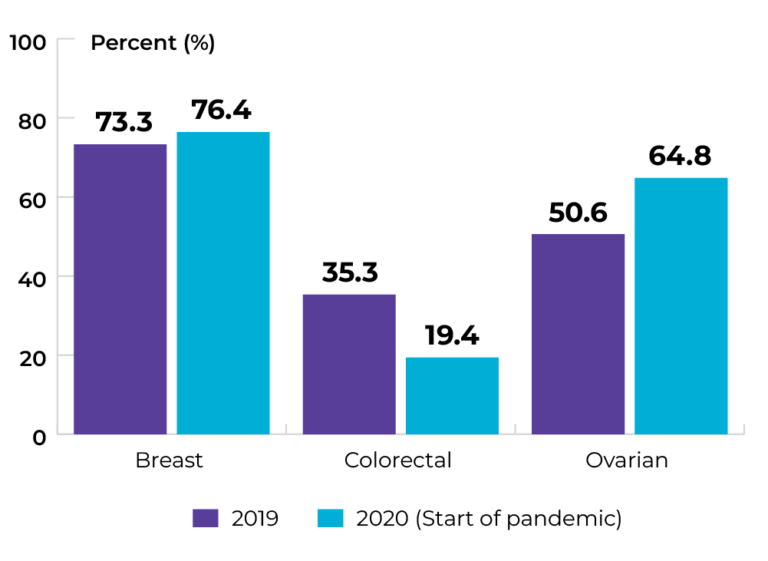
Data source: Provincial cancer agencies and programs
Priority 2 Action 1: Prioritize rapid access to appropriate diagnosis for those suspected of having cancer
Topic: Reducing wait for diagnosis
Title of image: Percentage of women that received their diagnosis within 5 weeks (no tissue sample) and 7 weeks (tissue sample) of their abnormal mammogram
Caveats/limitations: The COVID-19 pandemic may have affected service provision.
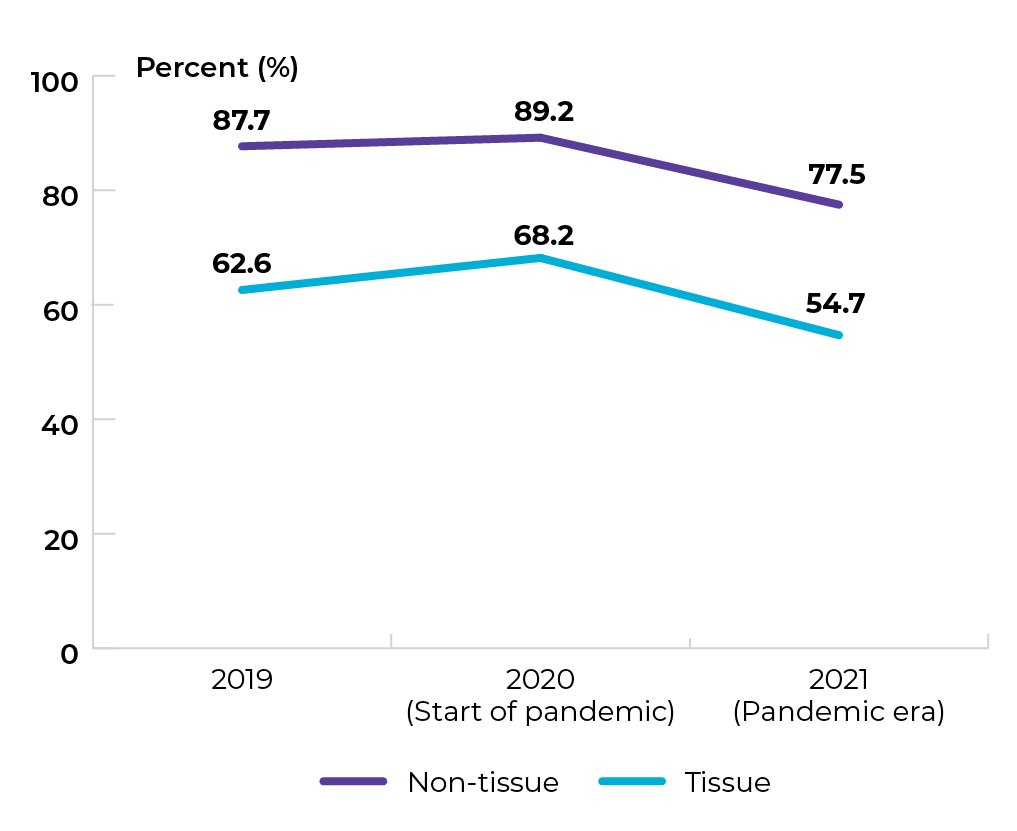
Data source: Provincial cancer agencies and programs
Topic: Diagnosing cancer earlier
Title of image: Proportion of stage at diagnosis in BC for lung cancer
Caveats/limitations: The COVID-19 pandemic may have affected service provision.
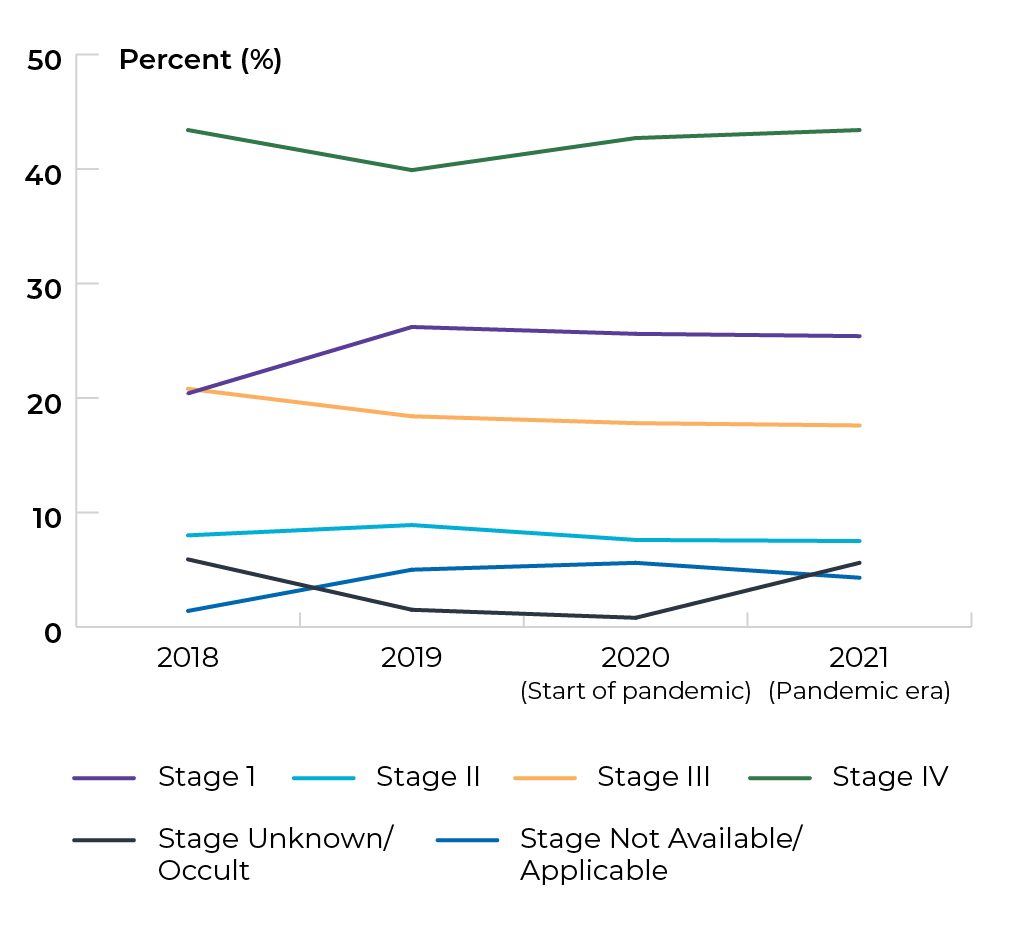
Title of table: Proportion of stage at diagnosis in BC for lung cancer
Stage201820192020 (Start of pandemic)2021 (Pandemic era)Stage I20.4%26.2%25.6%25.4%Stage II8.0%8.9%7.6%7.5 %Stage III20.8%18.4%17.8%17.6%Stage IV43.4%39.9%42.7%43.4%Stage unknown/occult 5.9%1.5%0.8%1.9%Stage not applicable1.4%5.0%5.6%4.3%
Data source: Provincial cancer agencies and programs
Topic: Diagnosing cancer earlier
Title of image: Proportion of stage at diagnosis in BC for colorectal cancer
Caveats/limitations:
- Colorectal cancer stage information is incomplete for a moderate number of incident cases each year (19.3%) and thus these data must be interpreted with some caution.
- The COVID-19 pandemic may have affected service provision.
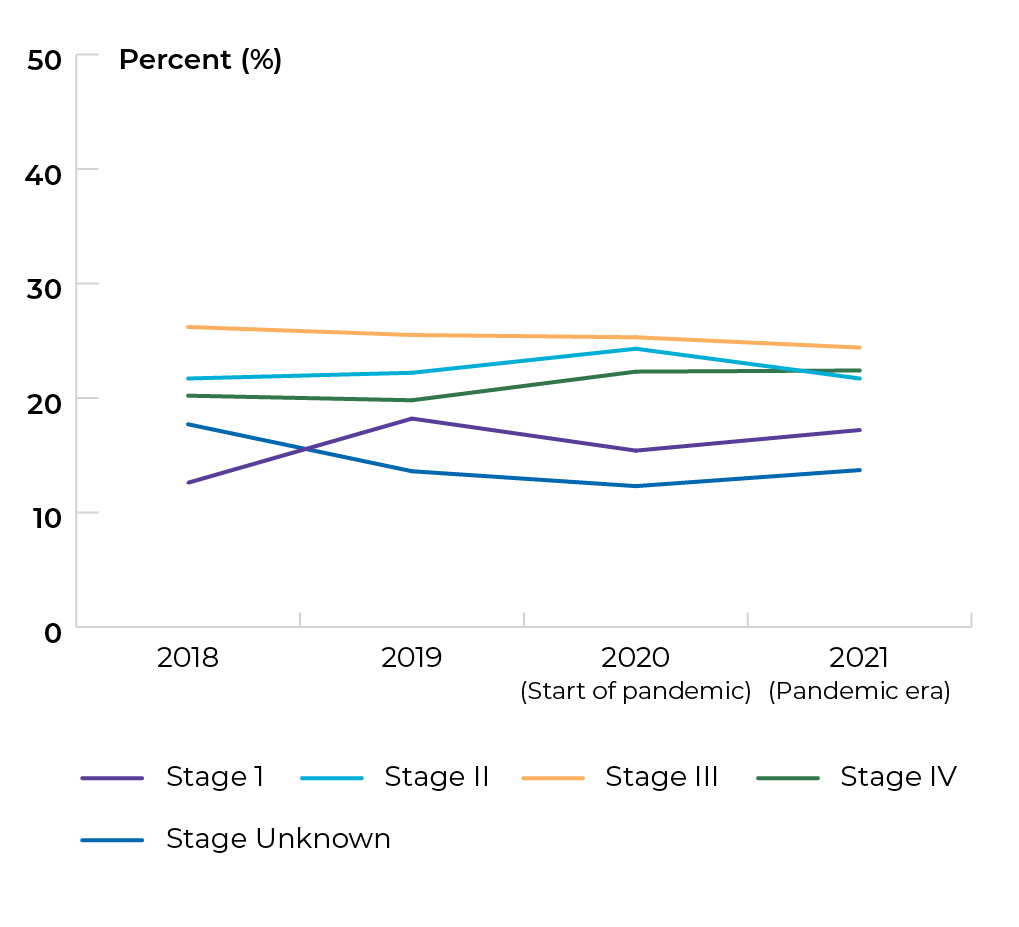
Title of table: Proportion of stage at diagnosis in BC for colorectal cancer
| Stage | 2018 | 2019 | 2020 (Start of pandemic) | 2021 (Pandemic era) |
|---|---|---|---|---|
| Stage I | 12.6% | 18.2% | 15.4% | 17.33% |
| Stage II | 21.7% | 22.2% | 24.3% | 21.73% |
| Stage III | 26.2% | 25.5% | 25.3% | 24.39% |
| Stage IV | 20.2% | 19.8% | 22.3% | 22.39% |
| Stage unknown/occult | 17.7% | 13.6% | 12.3% | 13.65% |
| Stage not applicable | 1.6% | 0.6% | 0.4% | 0.51% |
Data source: Provincial cancer agencies and programs
Topic: Diagnosing cancer earlier
Title of image: Proportion of stage at diagnosis in BC for bladder cancer
Caveats/limitations:
- The BC Cancer Registry only initiated collection of stage information that enables this indicator to be reported provincially in 2019.
- The COVID-19 pandemic may have affected service provision.

Data source: Provincial cancer agencies and programs
Topic: Diagnosing cancer earlier
Title of image: Proportion of stage at diagnosis in BC for melanoma
Caveats/limitations:
- The BC Cancer Registry only initiated collection of stage information that enables this indicator to be reported provincially in 2019.
- The COVID-19 pandemic may have affected service provision.

Data source: Provincial cancer agencies and programs
Topic: Diagnosing cancer earlier
Title of image: Age-standardized rate of stage 4 diagnosis in BC for lung cancer, by sex
Caveats/limitations: The COVID-19 pandemic may have affected service provision.

Data source: Provincial cancer agencies and programs
Topic: Diagnosing cancer earlier
Title of image: Age-standardized rate of stage 4 diagnosis in BC for colorectal cancer, by sex
Caveats/limitations: The COVID-19 pandemic may have affected service provision.
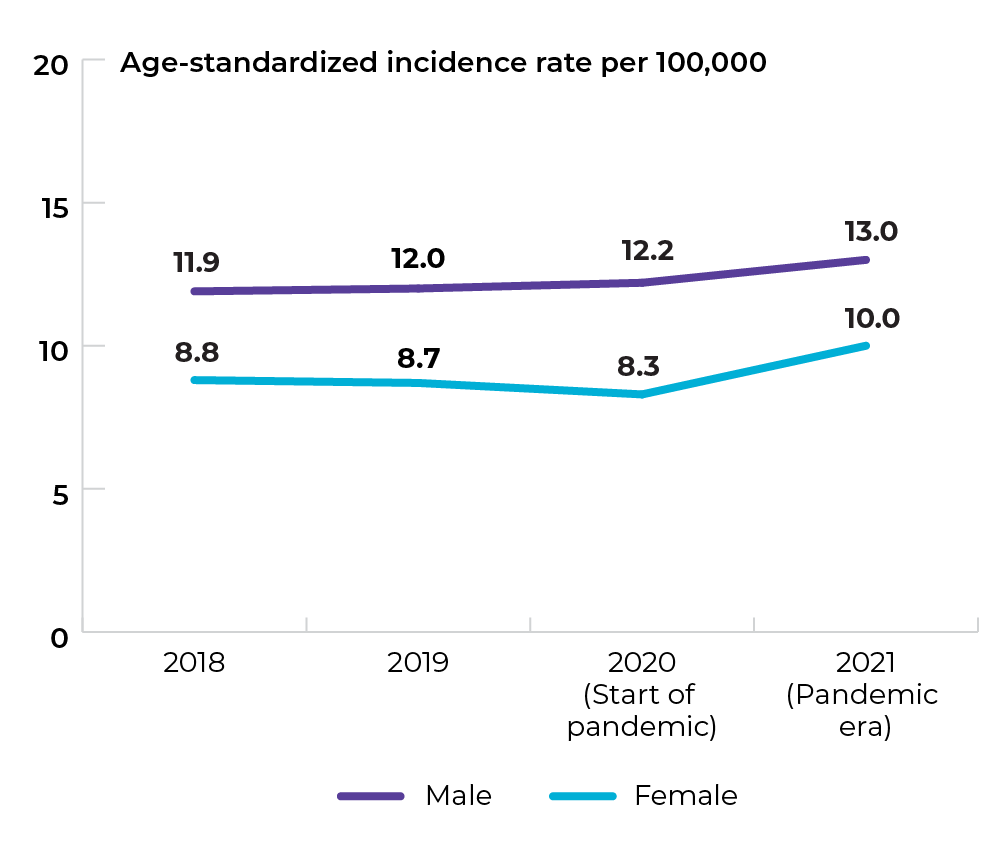
Data source: Provincial cancer agencies and programs
Topic: Diagnosing cancer earlier
Title of image: Age-standardized rate of stage 4 diagnosis in BC for bladder cancer, by sex
Caveats/limitations:
- The BC Cancer Registry only initiated collection of stage information that enables this indicator to be reported provincially in 2019.
- The COVID-19 pandemic may have affected service provision.

Data source: Provincial cancer agencies and programs
Topic: Diagnosing cancer earlier
Title of image: Age-standardized rate of stage 4 diagnosis in BC for melanoma, by sex
Caveats/limitations:
- The BC Cancer Registry only initiated collection of stage information that enables this indicator to be reported provincially in 2019.
- The COVID-19 pandemic may have affected service provision.

Data source: Provincial cancer agencies and programs
Priority 2 Action 2: Strengthen existing screening efforts and implement lung cancer screening programs across the country
Topic: Increasing participation in colorectal cancer screening
Title of image: Percentage of eligible people in BC who received colon screening using FIT
Caveats/limitations:
- Data does not truly reflect the proportion of the eligible population that is up to date for screening due to the exclusion of select proce dures such as colonoscopies. Thus these data reflect the proportion of the eligible population who had a program FIT over this period.
- Data is not included for the Northern Health Authority.
- The COVID-19 pandemic may have affected service provision.
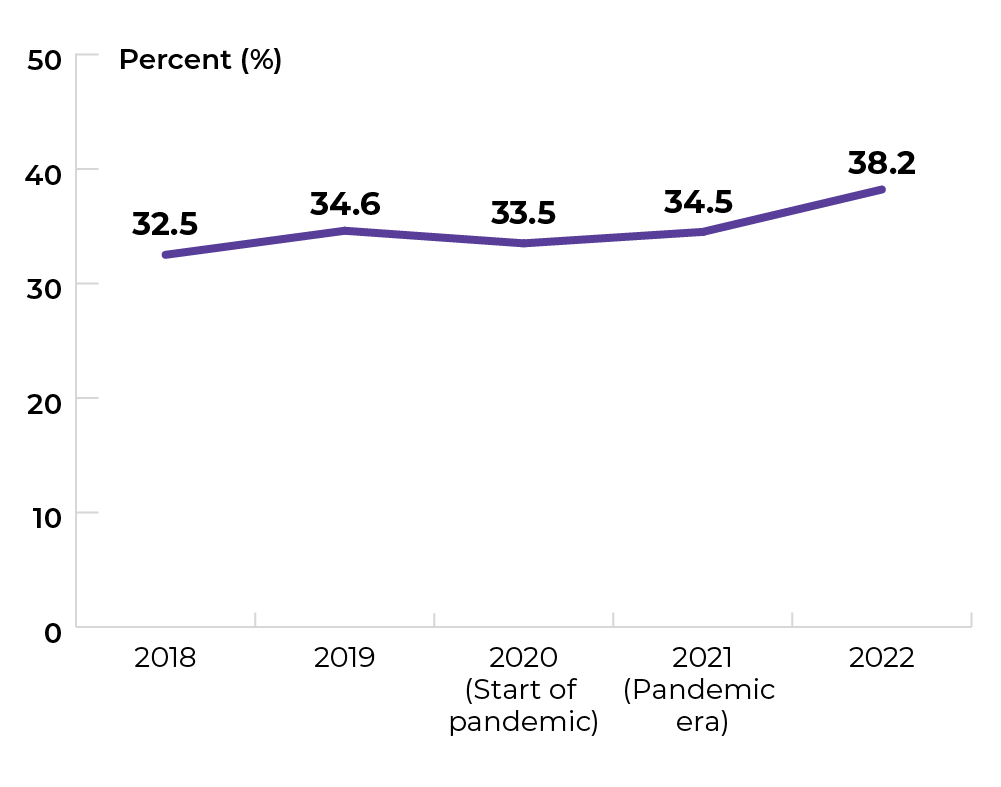
Data source: Provincial cancer agencies and programs
Topic: Increasing participation in colorectal cancer screening
Title of image: Percentage of eligible people in BC who received colon screening using FIT in 2020
Caveats/limitations:
- Data does not truly reflect the proportion of the eligible population that is up to date for screening due to the exclusion of select procedures such as colonoscopies. Thus these data reflect the proportion of the eligible population who had a program FIT over this period.
- Data is not included for the Northern Health Authority.
- The COVID-19 pandemic may have affected service provision.

Data source: Provincial cancer agencies and programs
Priority 3 Action 1: Set best practices and standards for care delivery and promote their adoption
Topic: Implementing multidisciplinary care
Title of image: Proportion of surgeons performing rectal cancer surgery where more than two thirds of their patients are presented at a multidisciplinary care conference (MCC) in 2020
Caveats/limitations:
- 27 surgeons, who on average performed ≥5 rectal cancer surgeries per year in 2019 & 2020, were sent the survey (a locally designed survey from the rectal cancer surgical tumour group to collect data on their MDC practices). 18 responded, giving a 67% response rate. However, respondents constituted 90% of the rectal cancer surgery volume in 2019 and 2020 for all surgeons who were sent the survey.
- The COVID-19 pandemic may have affected service provision.
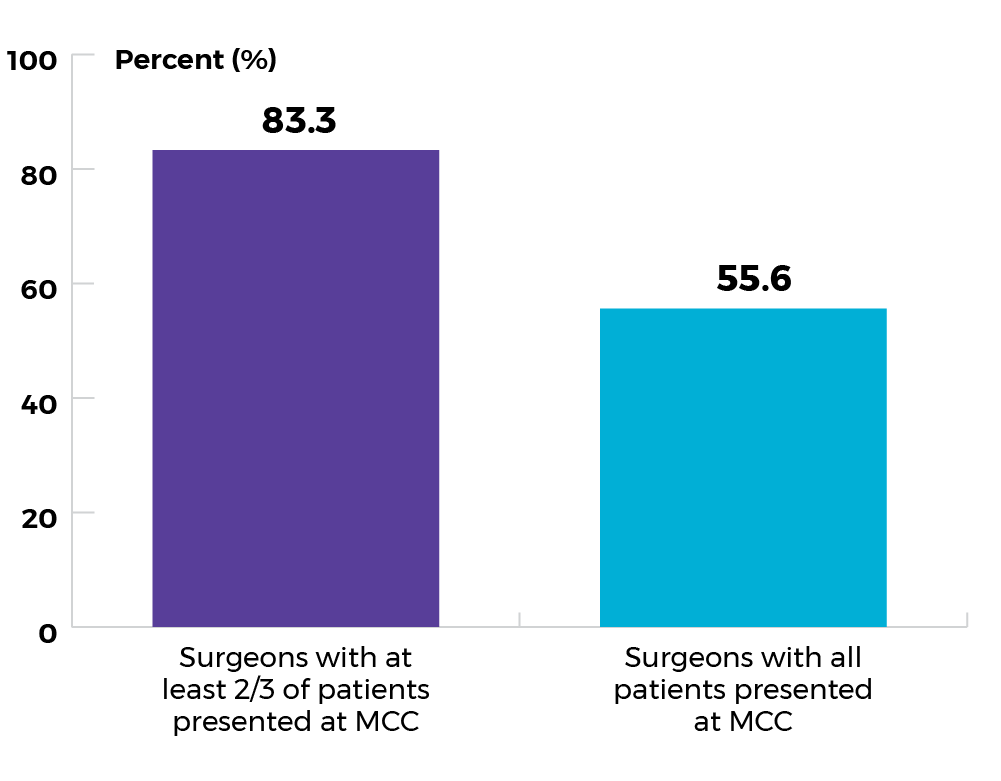
Data source: Provincial cancer agencies and programs
Priority 3 Action 2: Eliminate low-benefit practices and adopt high-value practices
Topic: Optimizing care at end of life
Title of image: Percentage of adult patients who received IV chemotherapy as an outpatient at a regional cancer centre within 14 days of death
Caveats/limitations: Includes only patients seen at BC Cancer centres. Includes only patients treated with IV chemotherapy; patients taking oral chemotherapy are excluded.
 Data source: Provincial cancer agencies and programs
Topic: Optimizing screening and appropriate follow-up
Title of image: Percentage of total annual Pap test volume that was among people with a cervix aged 18-24
Caveats/limitations: The COVID-19 pandemic may have affected service provision.
 Data source: Provincial cancer agencies and programs
Priority 4 Action 1: Provide better services and care adapted to the specific needs of underserved groups
Topic: Increasing access to culturally safe care
Title of image: Percentage of cancer patients that reported that the care they received was respectful of their values, culture, language preference, and gender identity
Caveats/limitations:
- The 2019 data was collected through the AOPPS patient survey. For the 2022 data, BC Cancer launched its own patient experience surveys within the regional cancer centres through the team-based care transition project.
- The COVID-19 pandemic may have affected service provision.
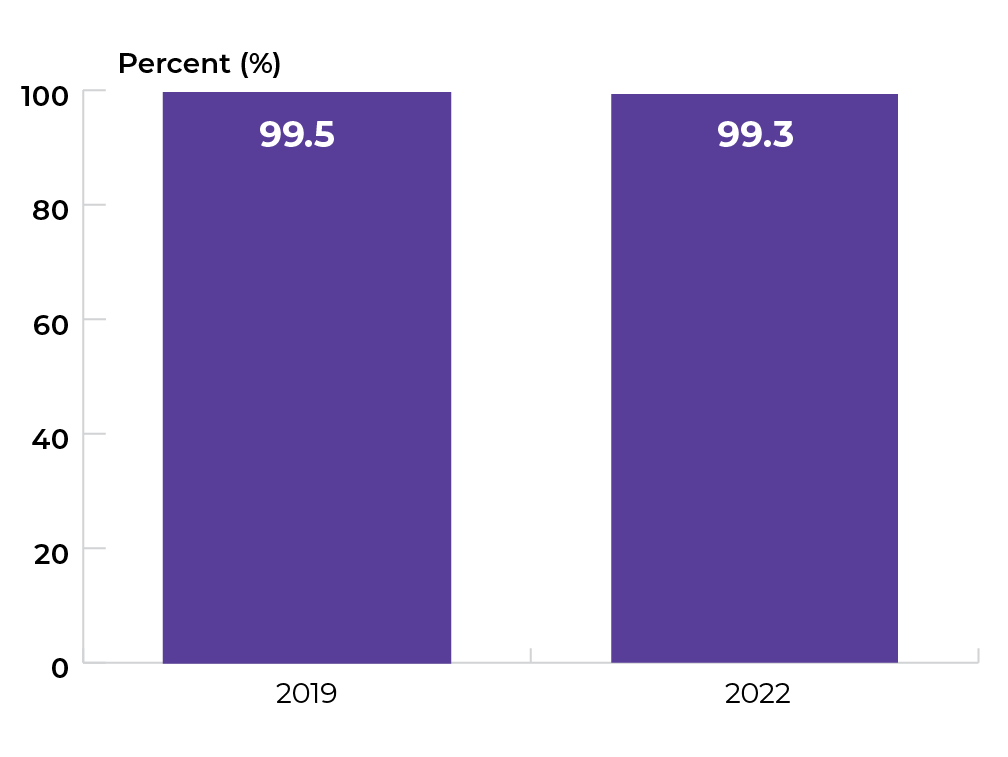
Data source: Provincial cancer agencies and programs
Priority 4 Action 2: Ensure rural and remote communities have the resources required to better serve their people
Topic: Increasing access to virtual care
Title of image: Percentage of patients with cancer from rural/remote communities using virtual health appointments, by fiscal year
Caveats/limitations: The COVID-19 pandemic may have affected service provision.
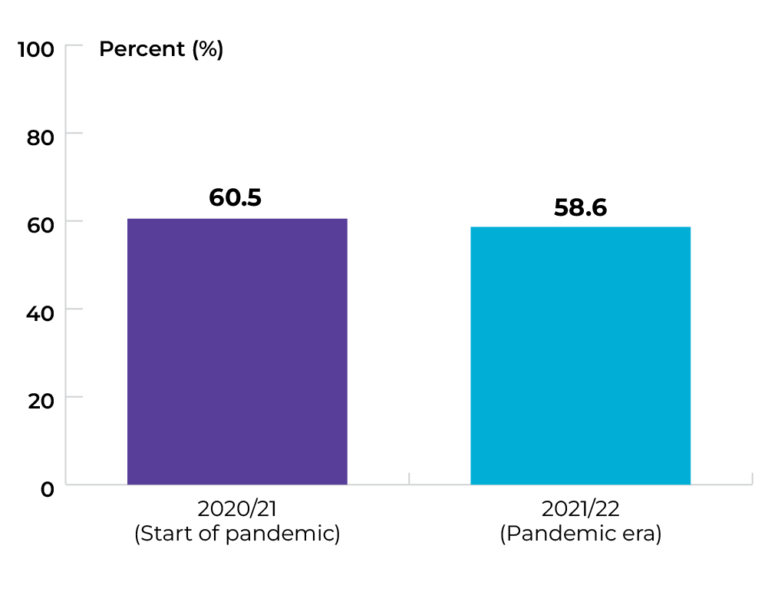
Data source: Provincial cancer agencies and programs
Topic: Increasing access to virtual care
Title of image: Percentage of patients with cancer from rural/remote communities using virtual health appointments, by treatment type and travel time
Caveats/limitations:
- Includes only individuals with valid postal codes in the BC Cancer EMR.
- The COVID-19 pandemic may have affected service provision.
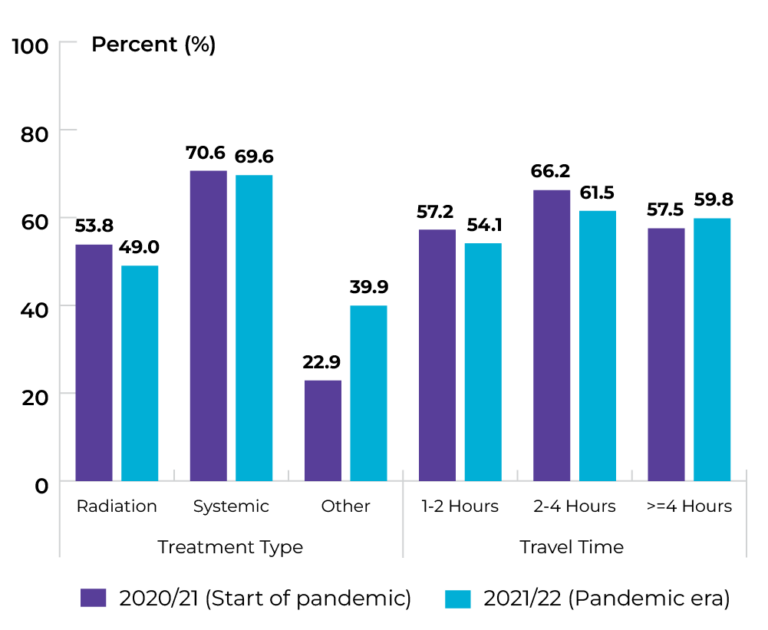
Data source: Provincial cancer agencies and programs
Priority 5 Action 1: Integrate the full spectrum of information and support services to ensure people are fully supported throughout the cancer experience
Topic: Improving availability of information and support
Title of image: Percentage of cancer patients who reported a positive response related to their informational needs being met during the cancer care journey
Caveats/limitations: The COVID-19 pandemic may have affected service provision.

Data source: Provincial cancer agencies and programs
Topic: Improving access to shared medical records
Title of image: Ratio of physicians on-boarded onto CareConnect to the number of unique physicians with privileges in each health authority
Caveats/limitations:
- A ratio close to 1 would be considered a target (i.e., there are similar numbers of physicians onboarded in each health authority as there are physicians with privileges).
- Data were provided in aggregate format by provincial or regional health authority. It is possible that some physicians have privileges in two separate health authorities and are thus double counted in either the numerator or denominator.
- Includes only physicians with privileges in one of the regional or provincial health authorities. Data excludes any physicians without privileges.
- The COVID-19 pandemic may have affected service provision.

Data source: Provincial cancer agencies and programs
Topic: Improving access to shared medical records
Title of image: Ratio of physicians on-boarded onto CareConnect to the number of unique physicians with privileges in each health authority, by region
Caveats/limitations:
- It is possible for a physician to be counted more than once in the aggregate numerator total. If a physician works at two health authorities (e.g. works at both VCH and at PHSA) and has CareConnect access set up at both health authorities, they would be included in the counts at each health authority (e.g. once under VCH and once under PHSA).
- The COVID-19 pandemic may have affected service provision.

Fraser Health Authority (FHA), Interior Health Authority (IHA), Northern Health Authority (NHA), Providence Health Care (PHC), Provincial Health Services Authority (PHSA), Vancouver Coastal Health Authority (VCHA), Vancouver Island Health Authority (VIHA)
Data source: Provincial cancer agencies and programs
The data tables and technical appendix for all indicators are available upon request at info@partnershipagainstcancer.ca. You will receive a response in two to three business days.