Supplementary data: Alberta
This page provides data visualizations related to the priorities for Canada’s cancer system.
The data tables and technical appendix for all indicators are available upon request at info@partnershipagainstcancer.ca.
Priority 1 Action 1: Help people to stop smoking or not start in the first place and live healthier lives
Topic: Keeping people smoke-free
Title of image: Percentage of individuals in AB (aged ≥ 12) classified as daily or occasional smokers
Caveats/limitations:
- This indicator was reported using the Canadian Community Health Survey (CCHS).
- Individuals who did not respond to the required CCHS questions regarding smoking status were not included in the analysis.
- The COVID-19 pandemic had major impacts on the data collection operations and response rates for this survey.
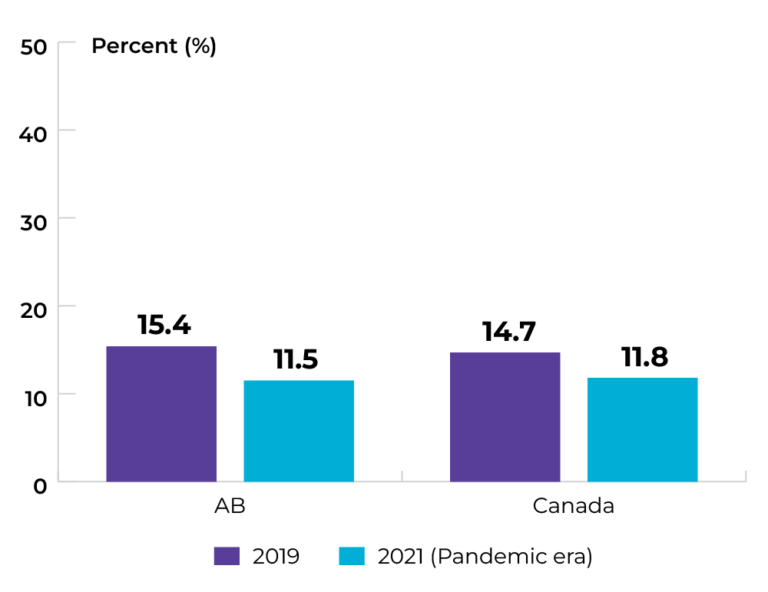
Data source: Canadian Community Health Survey
Topic: Maintaining healthy body weight
Title of image: Percentage of individuals (aged ≥ 18) classified as overweight or obese
Caveats/limitations: The COVID-19 pandemic had major impacts on the data collection operations and response rates for this survey.
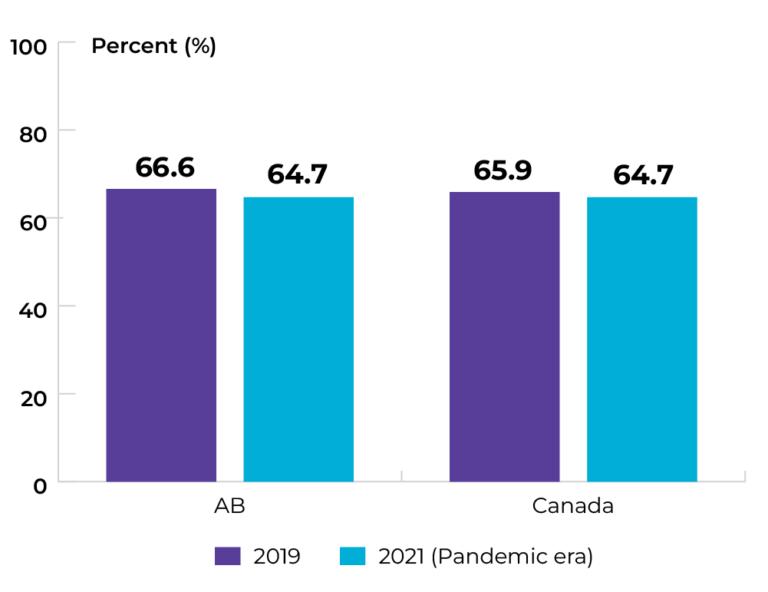
Data source: Canadian Community Health Survey
Topic: Maintaining healthy body weight
Title of image: Percentage of individuals (aged ≥ 18) classified as overweight or obese, by sex
Caveats/limitations: The COVID-19 pandemic had major impacts on the data collection operations and response rates for this survey.
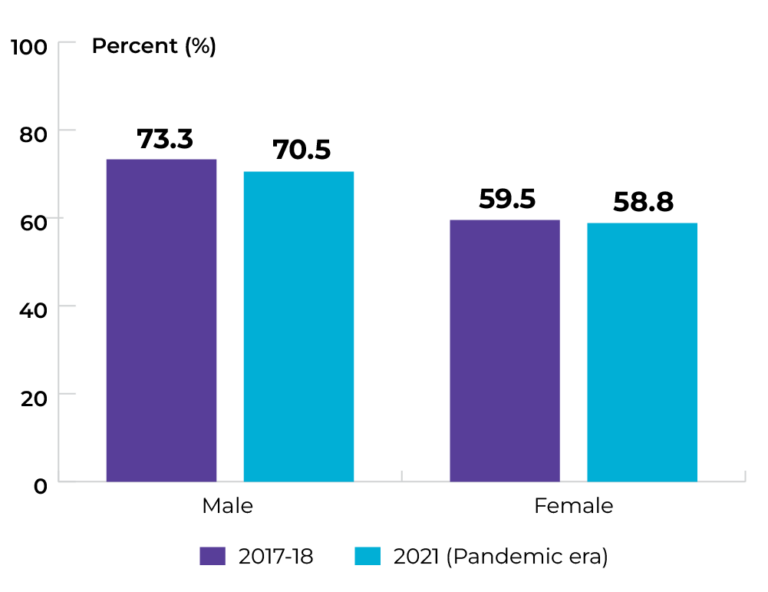 Data source: Canadian Community Health Survey
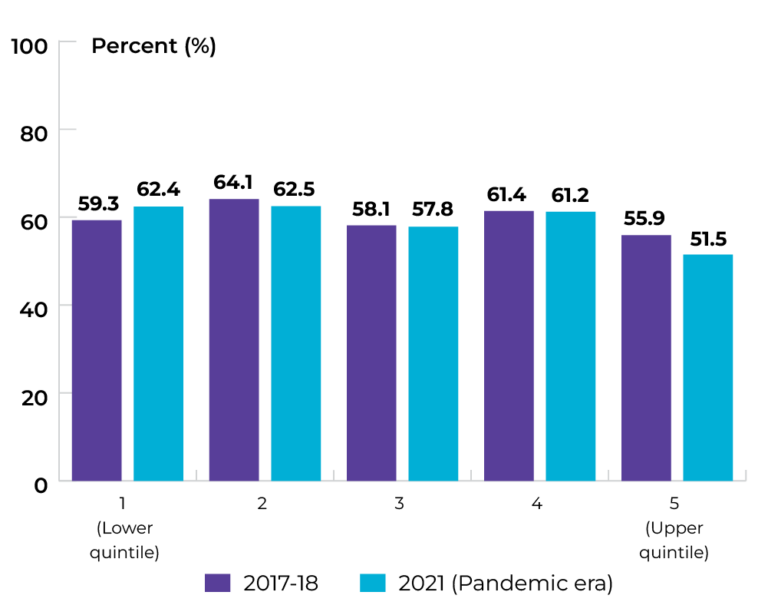
Topic: Maintaining healthy body weight
Title of image: Percentage of males (aged ≥ 18) classified as overweight or obese, by income quintile
Caveats/limitations: The COVID-19 pandemic had major impacts on the data collection operations and response rates for this survey.
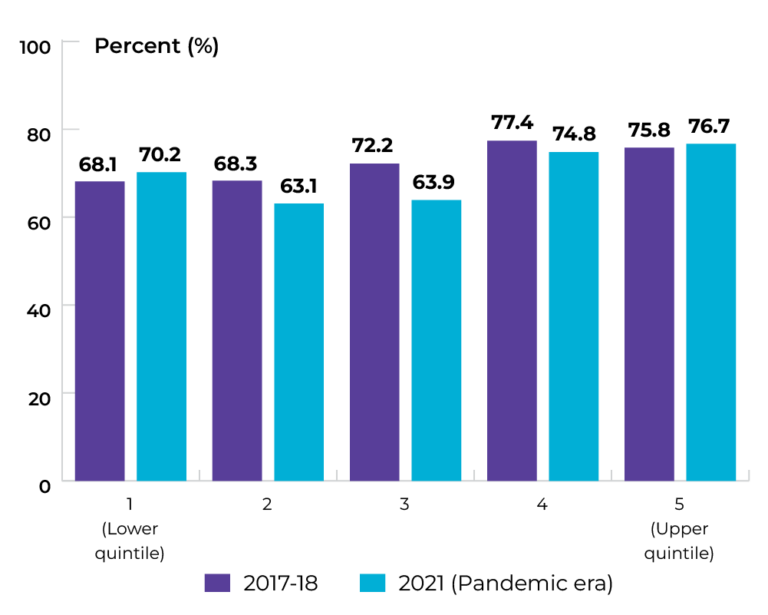
Data source: Canadian Community Health Survey
Topic: Maintaining healthy body weight
Title of image: Percentage of females (aged ≥ 18) classified as overweight or obese, by income quintile
Caveats/limitations: The COVID-19 pandemic had major impacts on the data collection operations and response rates for this survey.
Data source: Canadian Community Health Survey
Priority 1 Action 2: Adopt proven practices known to reduce the risk of cancer
Topic: Increasing HPV vaccination
Title of image: Percentage of people who received a full course of HPV vaccination
Caveats/limitations:
- Updated schedule for HPV vaccinations in Alberta specifies that children aged 9-14 years who are able to produce a normal immune response and who do not have HIV will receive a 2-dose series.
- A full course of HPV vaccination was considered two doses by age 12 in 2019 but was changed to two doses by age 13 in 2020.
- The COVID-19 pandemic may have affected service provision.
Data source: Provincial cancer agencies and programs
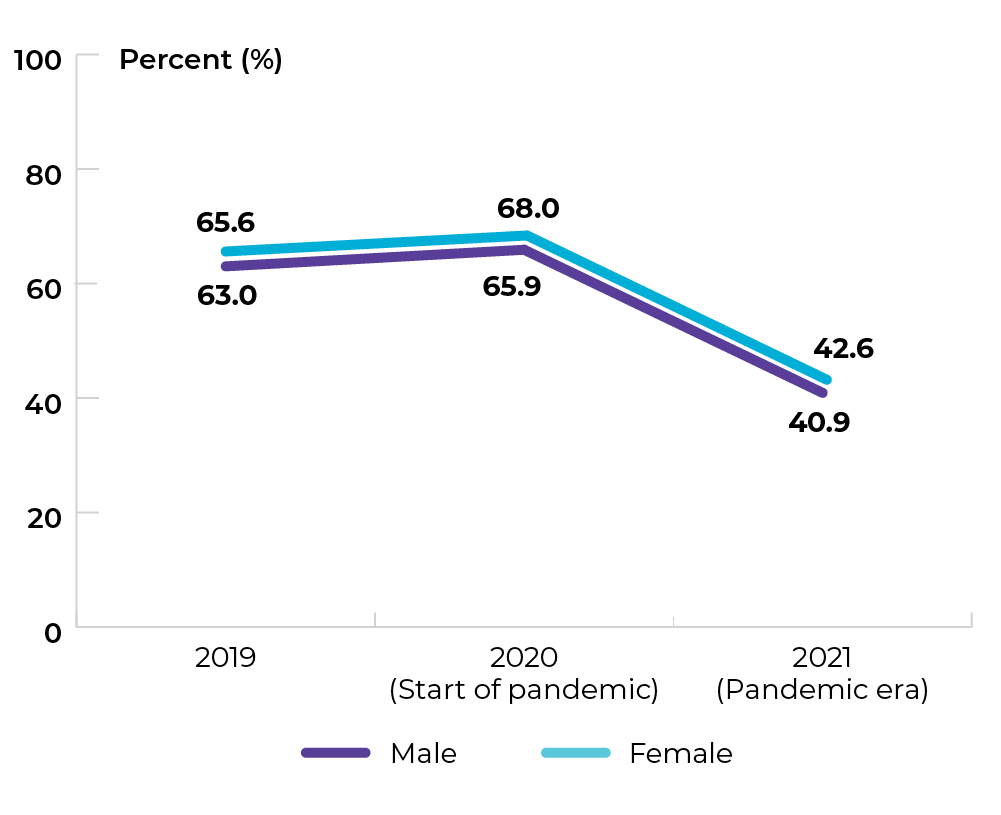
Topic: Increasing genetic testing
Title of image: Percentage of female patients in AB diagnosed with breast or ovarian cancer who received genetic testing within 9 months of diagnosis
Caveats/limitations:
- Some patients may seek private genetic testing to guide treatment. Private genetic testing data is not available.
- The COVID-19 pandemic may have affected service provision.
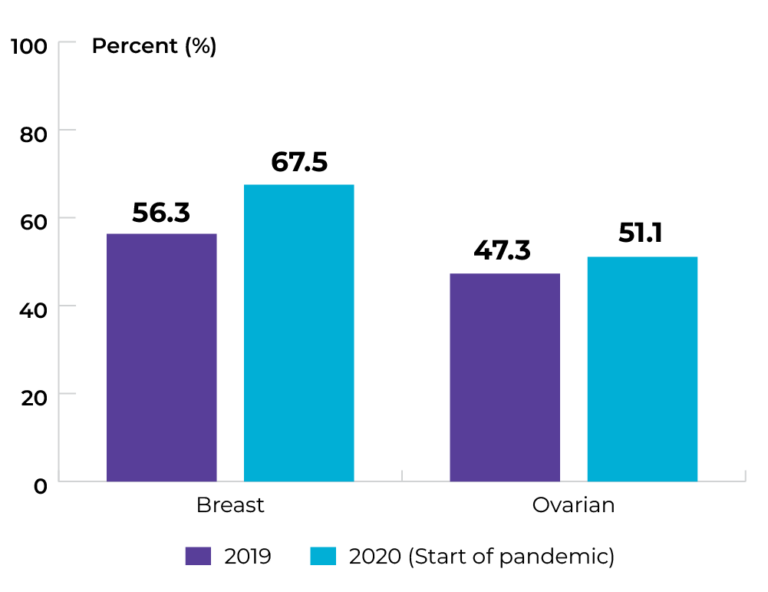
Data source: Provincial cancer agencies and programs
Topic: Increasing genetic testing
Title of image: Percentage of patients in AB diagnosed with breast cancer who received genetic testing within 9 months of diagnosis, by sex
Caveats/limitations: The COVID-19 pandemic may have affected service provision.
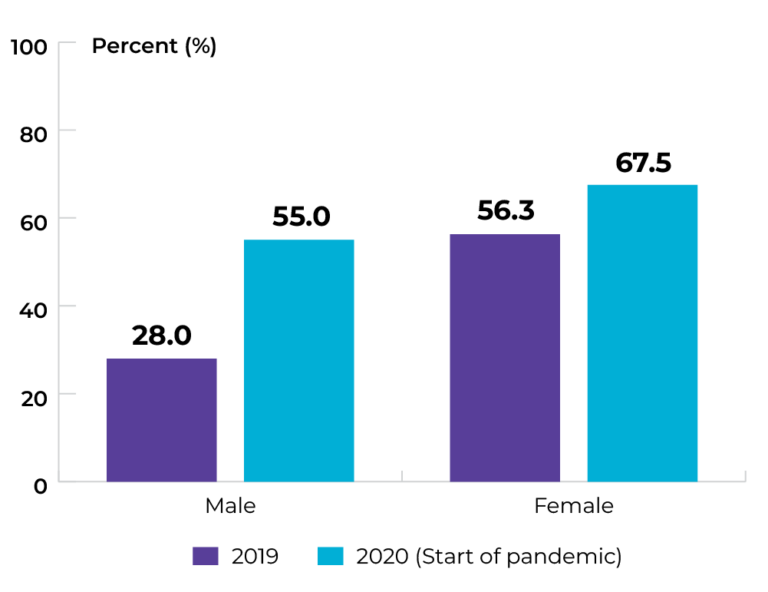 Data source: Provincial cancer agencies and programs
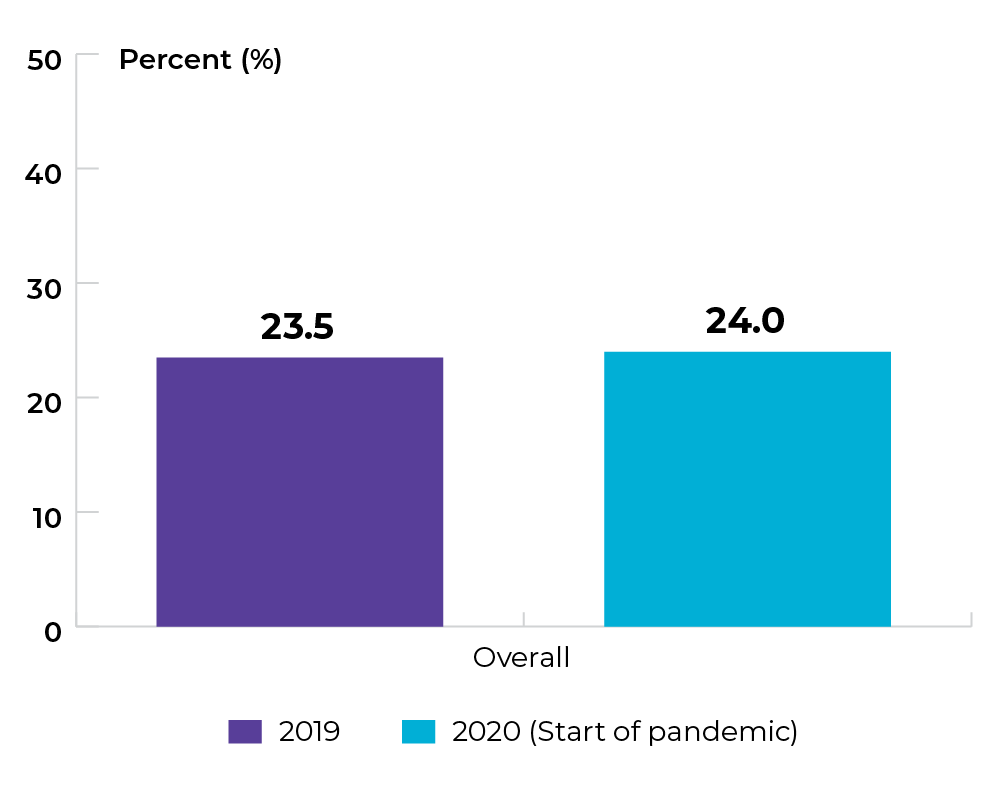
Priority 2 Action 1: Prioritize rapid access to appropriate diagnosis for those suspected of having cancer
Topic: Reducing wait for diagnosis
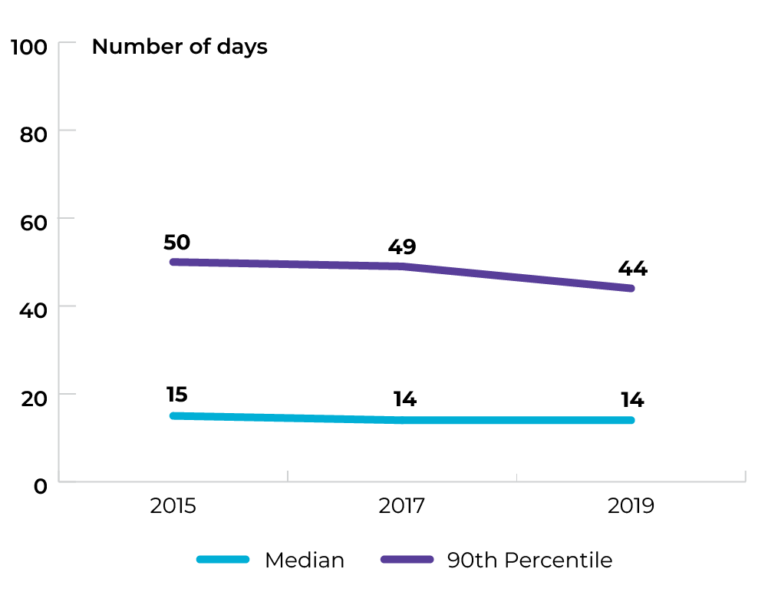
Title of image: Time from suspicion of cancer to definitive diagnosis of colorectal cancer
Caveats/limitations: The COVID-19 pandemic may have affected service provision.
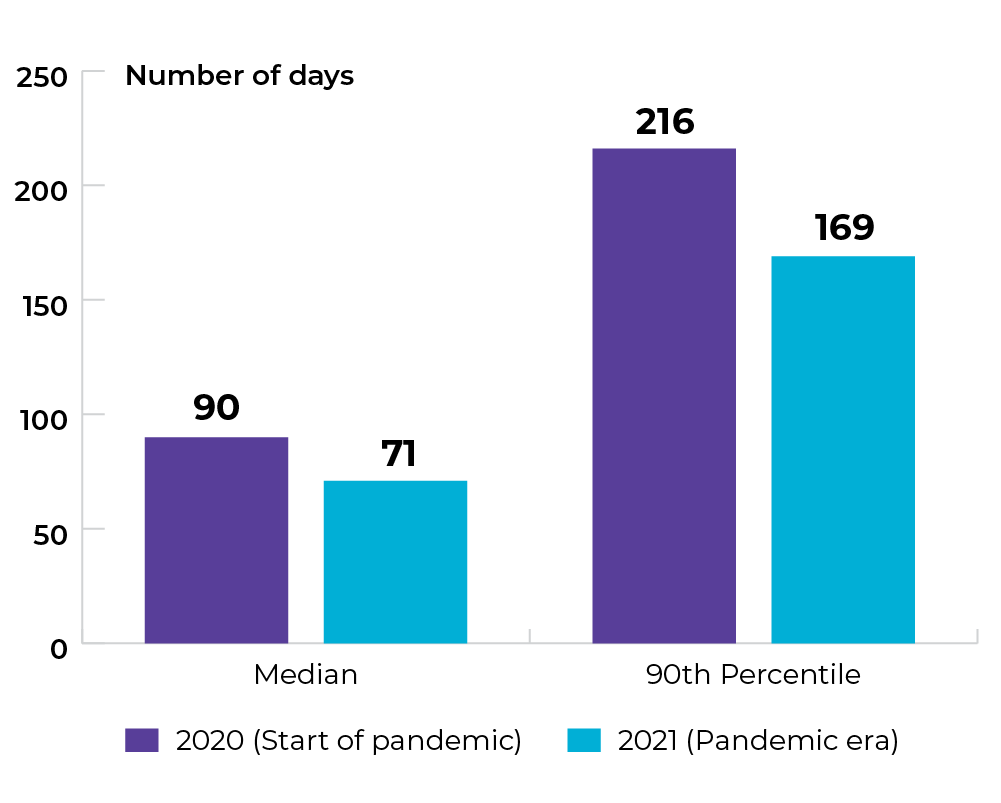
Data source: Provincial cancer agencies and programs
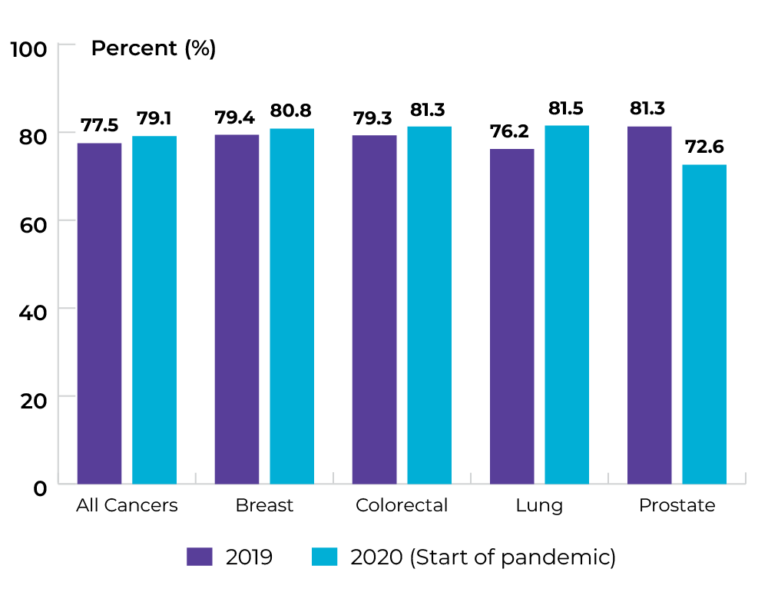
Topic: Diagnosing cancer earlier
Title of image: Proportion of stage 4 diagnosis in AB, by sex
Caveats/limitations: The COVID-19 pandemic may have affected service provision.
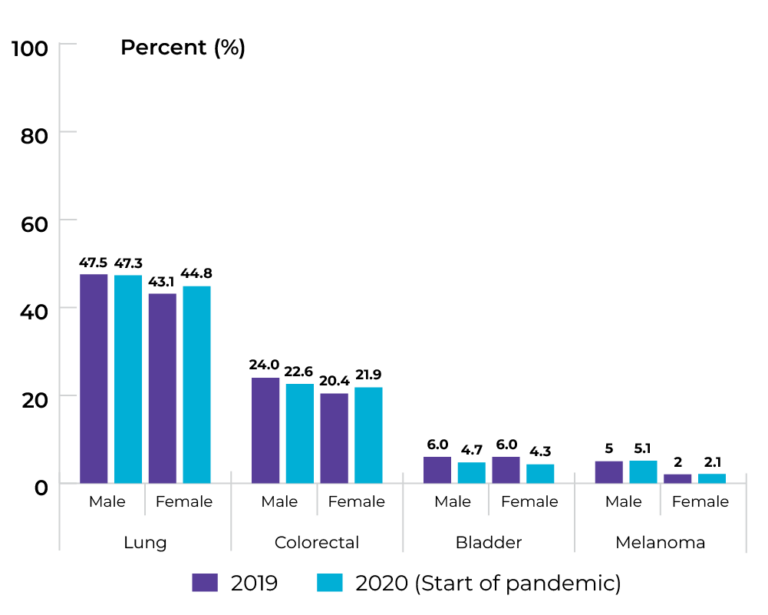
Data source: Provincial cancer agencies and programs
Topic: Diagnosing cancer earlier
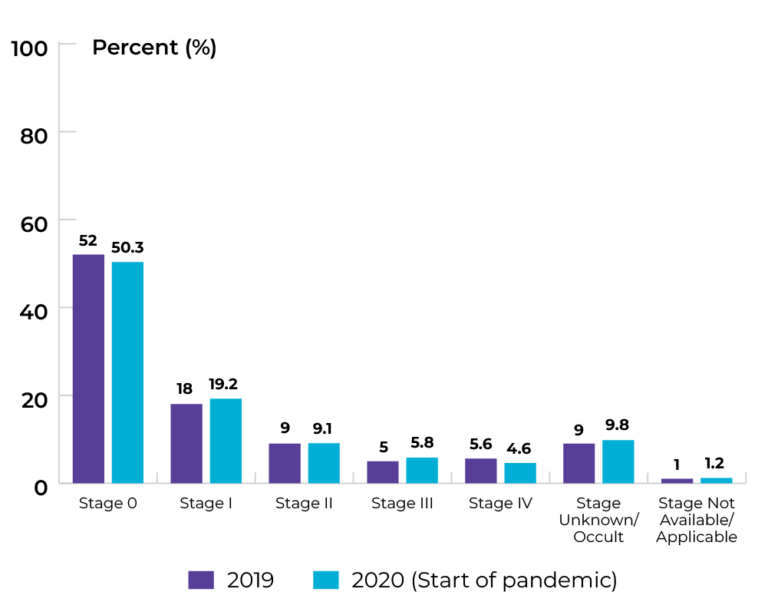
Title of image: Proportion of stage at diagnosis for lung cancer
Caveats/limitations: The COVID-19 pandemic may have affected service provision.
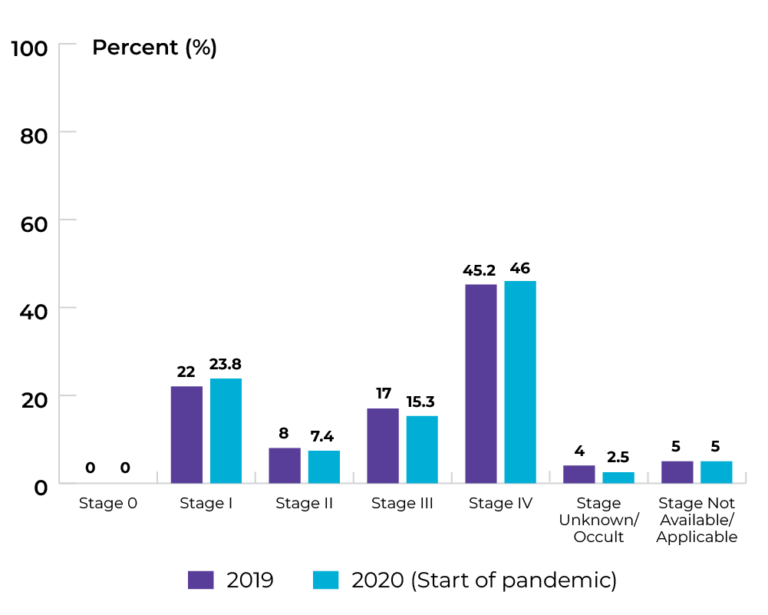
Data source: Provincial cancer agencies and programs
Topic: Diagnosing cancer earlier
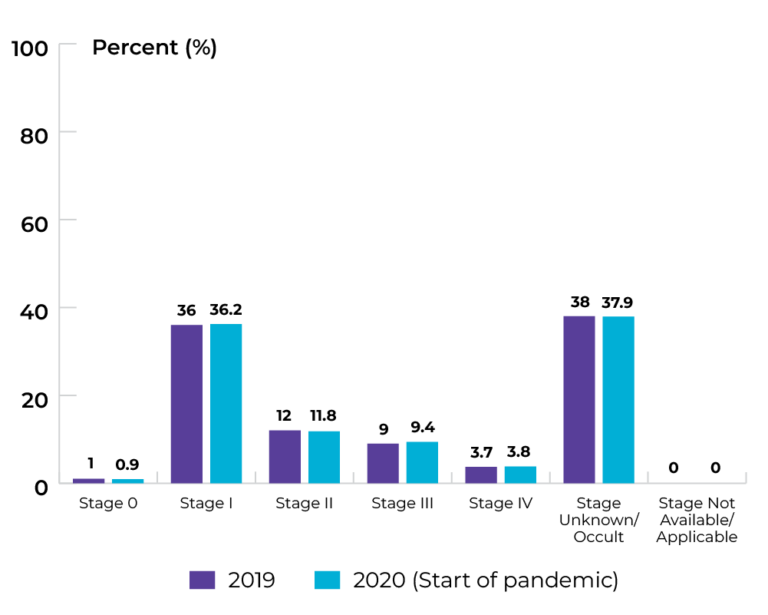
Title of image: Proportion of stage at diagnosis for colorectal cancer
Caveats/limitations: The COVID-19 pandemic may have affected service provision.
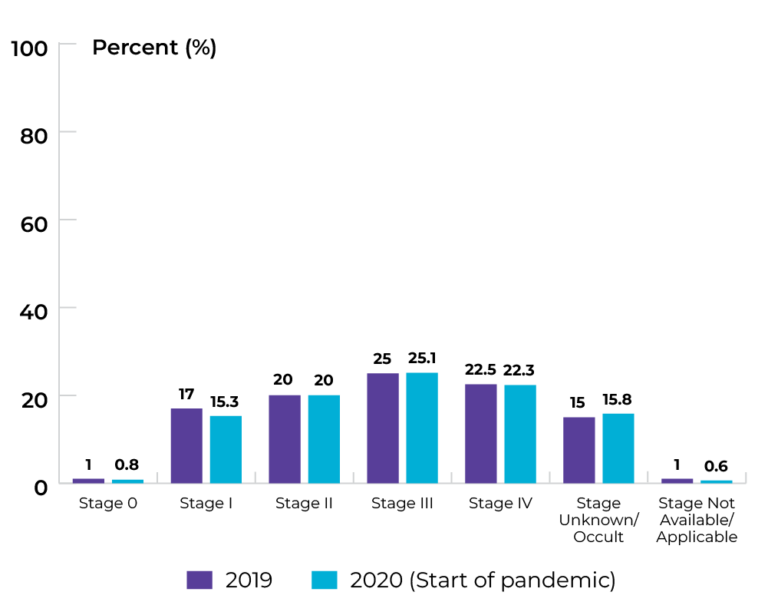 Data source: Provincial cancer agencies and programs
Topic: Diagnosing cancer earlier
Title of image: Proportion of stage at diagnosis for bladder cancer
Caveats/limitations: The COVID-19 pandemic may have affected service provision.
 Data source: Provincial cancer agencies and programs
Topic: Diagnosing cancer earlier
Title of image: Proportion of stage at diagnosis for melanoma
Caveats/limitations: The COVID-19 pandemic may have affected service provision.
Data source: Provincial cancer agencies and programs
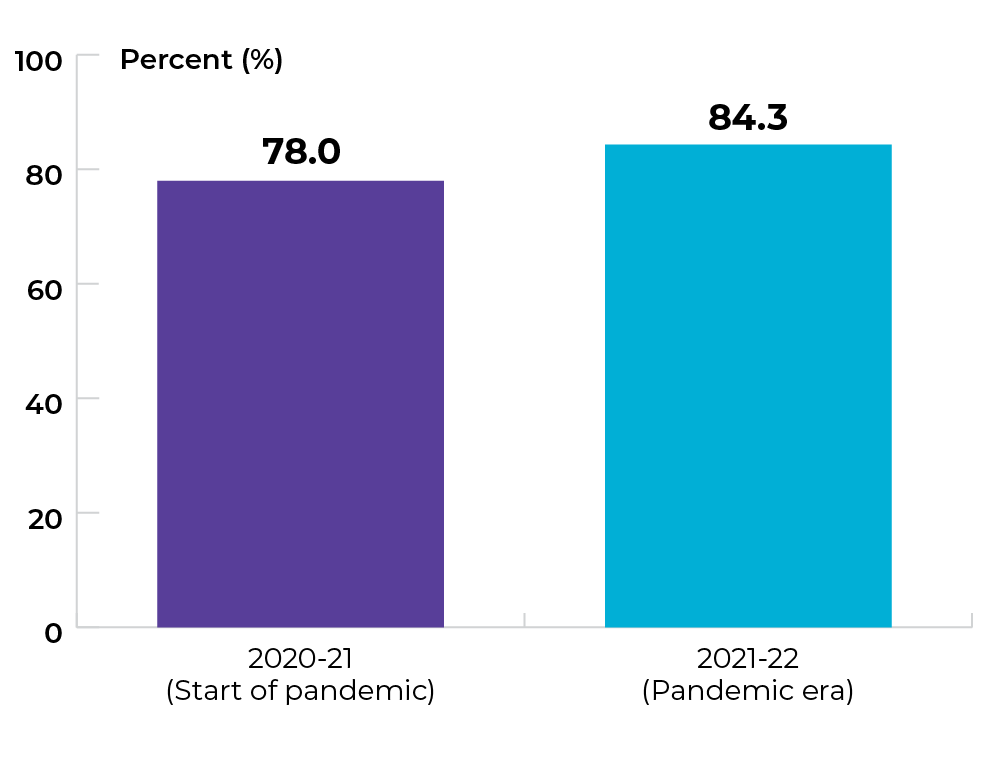
Priority 2 Action 2: Strengthen existing screening efforts and implement lung cancer screening programs across the country
Topic: Increasing participation in colorectal cancer screening
Title of image: Percentage of AB who had FIT test in past two years and/or sigmoidoscopy/colonoscopy in the past five years, by age group
Caveats/limitations:
- Participation in the 50-54 age group is expected to be the lowest as those in this age group recently became eligible for screening (e.g., someone aged 51 years would be asked whether they received sigmoidoscopy/colonoscopy in the last five years but has only been eligible for screening for the last two years).
- The COVID-19 pandemic may have affected service provision.
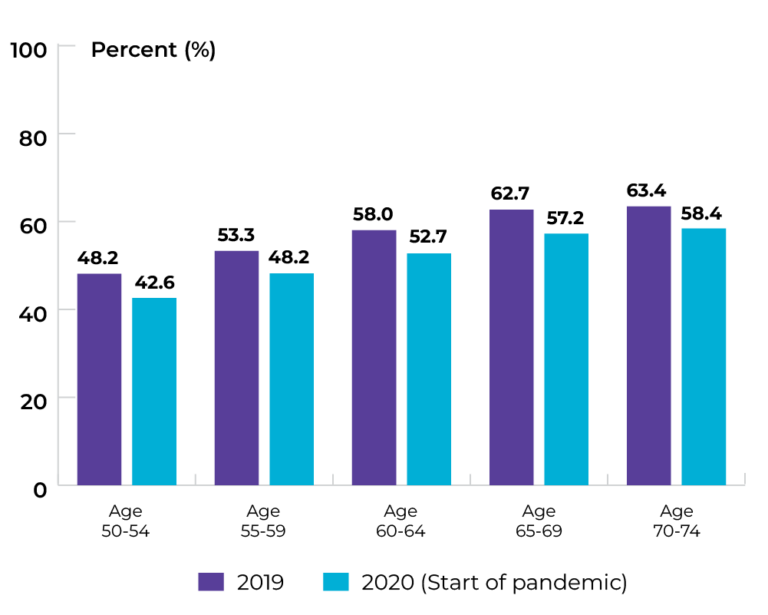 Data source: Provincial cancer agencies and programs
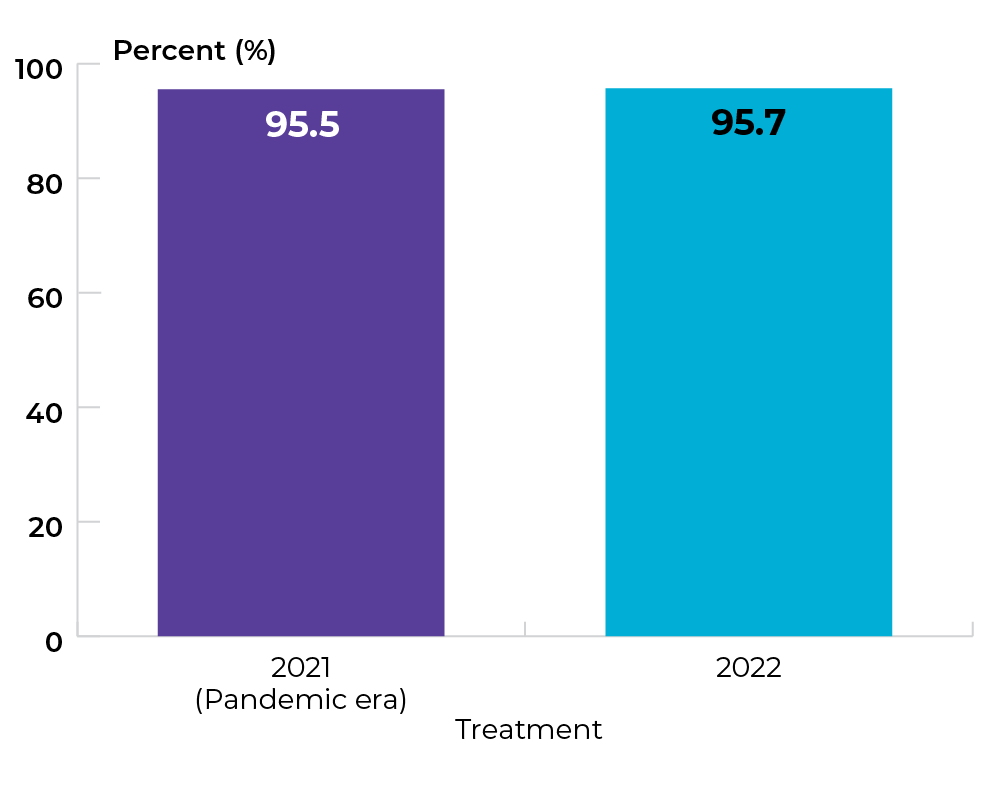
Priority 3 Action 2: Eliminate low-benefit practices and adopt high-value practices
Topic: Optimizing care at end of life
Title of image: Percentage of patients who died of cancer and received any systemic therapy in the last two weeks of life
Caveats/limitations: The COVID-19 pandemic may have affected service provision.
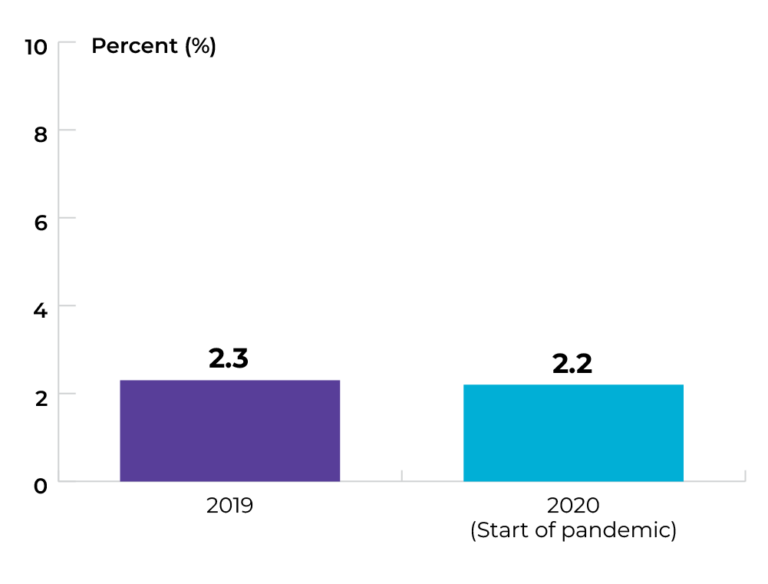 Data source: Provincial cancer agencies and programs
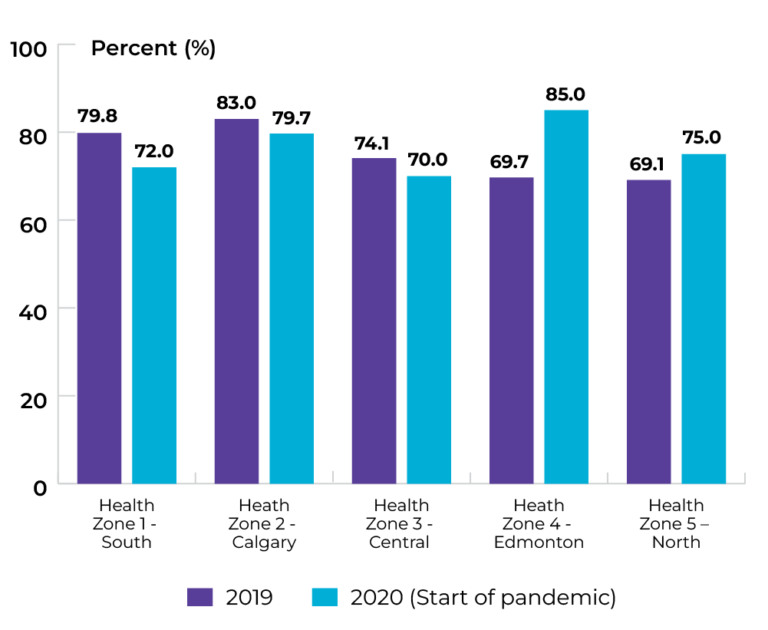
Topic: Optimizing care at end of life
Title of image: Percentage of patients who died of cancer and received any systemic therapy in the last two weeks of life, by health zone
Caveats/limitations: The COVID-19 pandemic may have affected service provision.
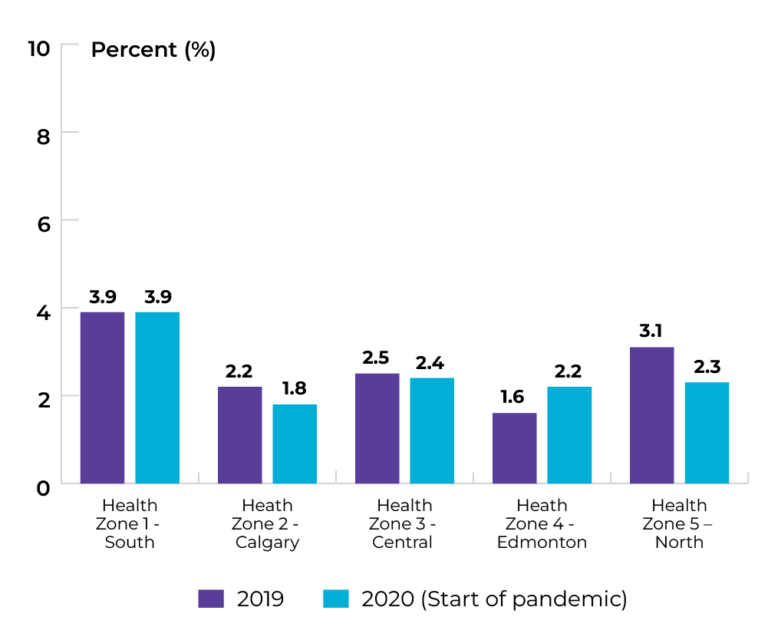 Data source: Provincial cancer agencies and programs
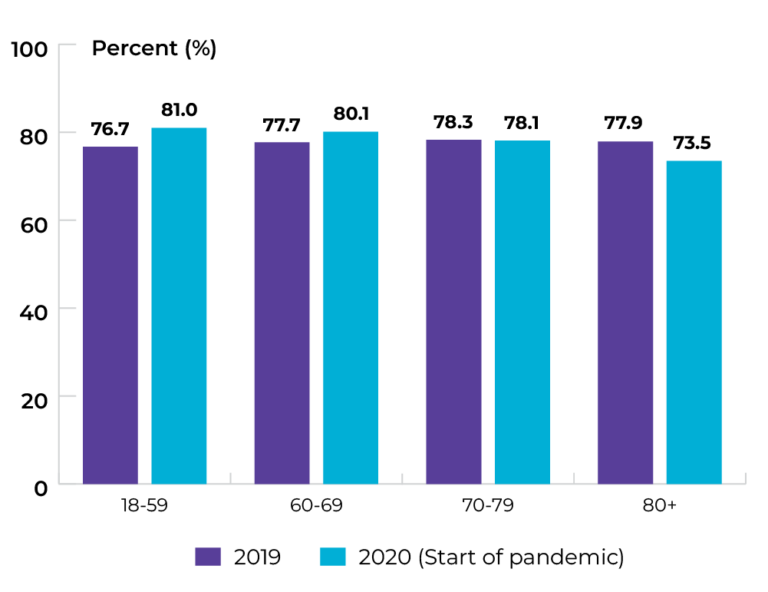
Topic: Optimizing care at end of life
Title of image: Percentage of patients who died of cancer and received any systemic therapy in the last two weeks of life, by age group
Caveats/limitations: The COVID-19 pandemic may have affected service provision.
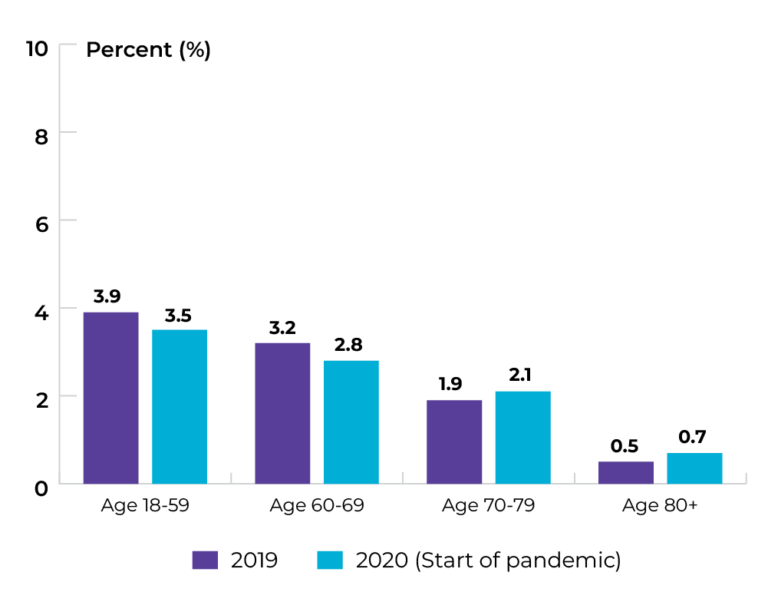 Data source: Provincial cancer agencies and programs
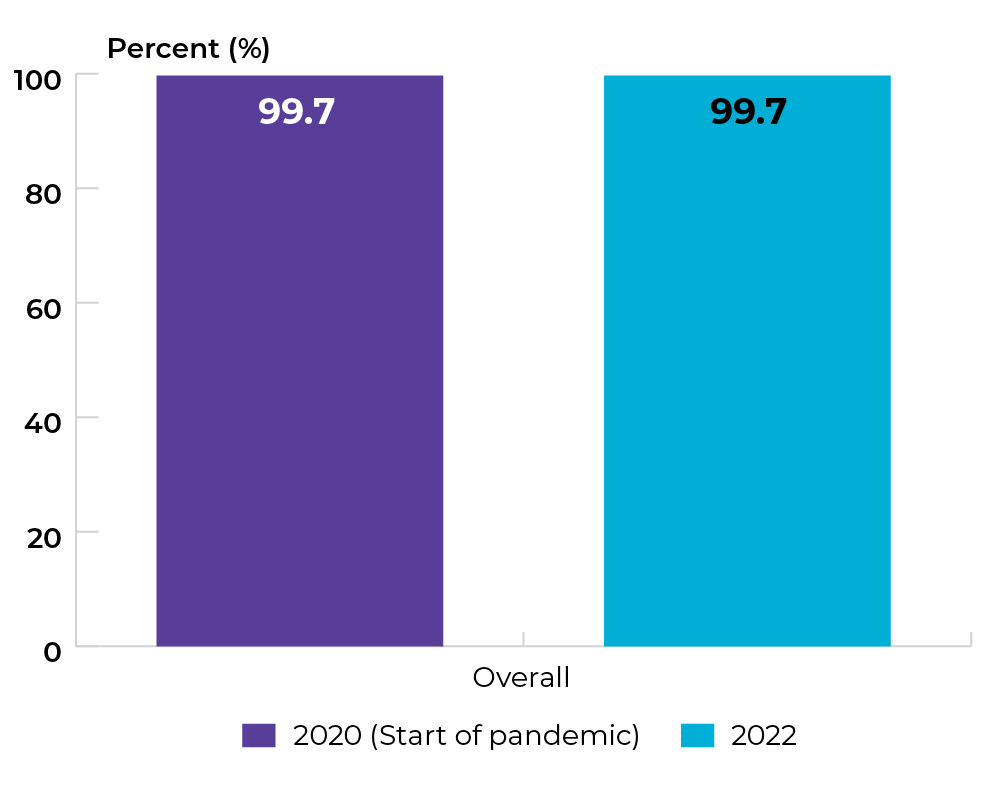
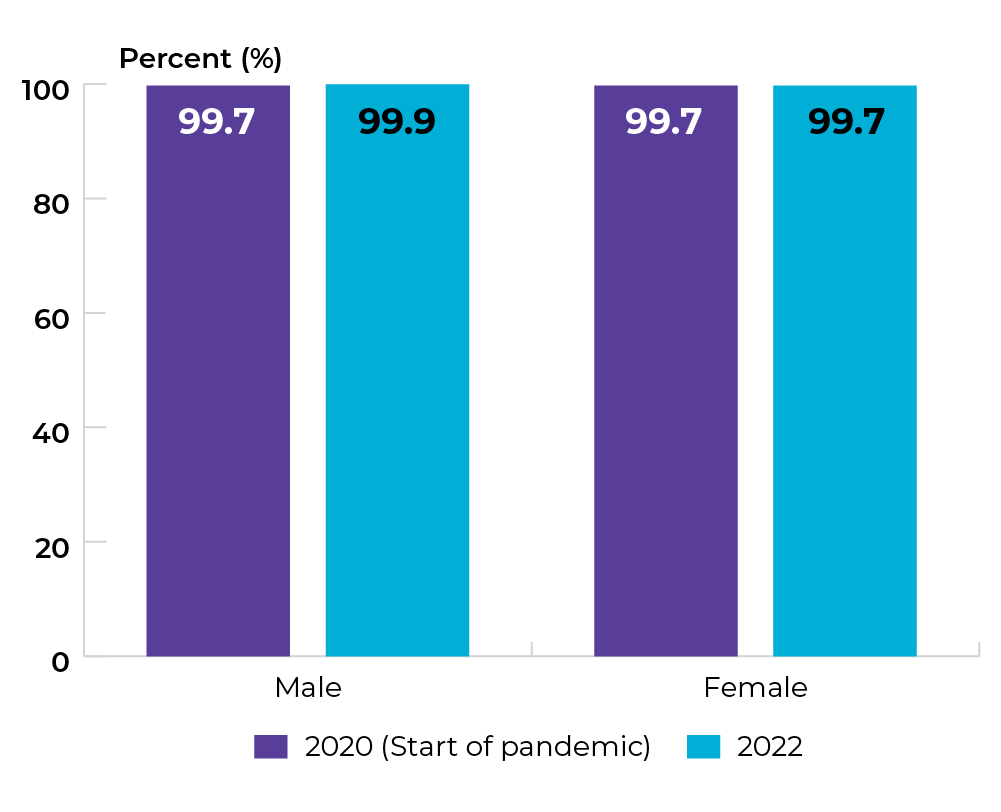
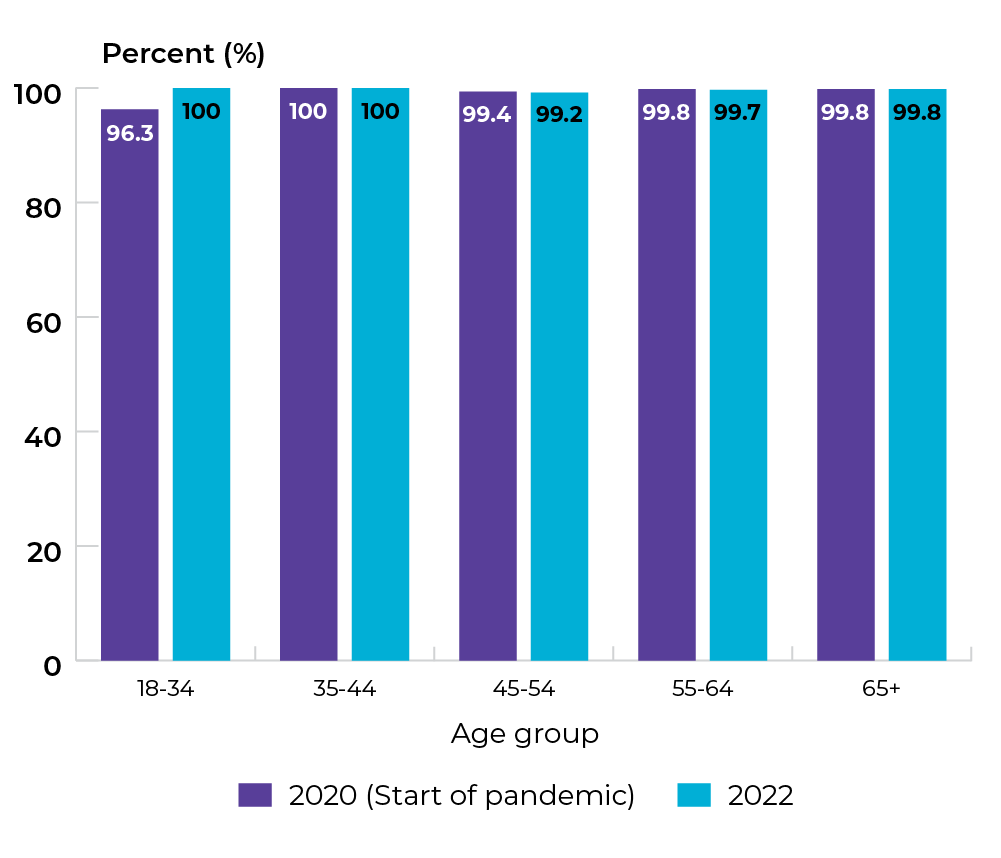
Topic: Optimizing screening and appropriate follow-up
Title of image: Percentage of eligible individuals aged 25-69 who were up-to-date* for screening during a 42-month period
*Includes individuals who completed at least one Pap test or colposcopy exam.
Caveats/limitations: The COVID-19 pandemic may have affected service provision.
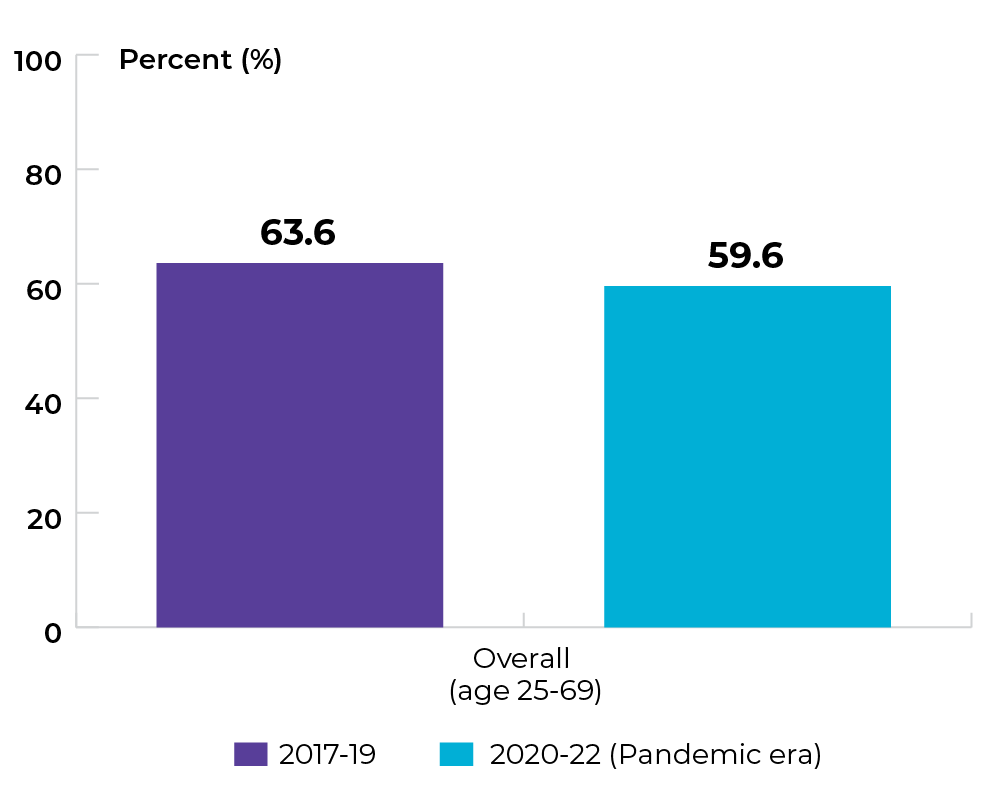
Data source: Provincial cancer agencies and programs
Priority 3 Action 3: Design and implement new models of care
Topic: Expanding models of care
Title of image: Percentage of new-to-institution patients attending a first consult who completed the patient reported outcomes tools at the time of the consult, by cancer type
Caveats/limitations: The COVID-19 pandemic may have affected service provision.
Data source: Provincial cancer agencies and programs
Topic: Expanding models of care
Title of image: Percentage of new-to-institution patients attending a first consult who completed the patient reported outcomes tools at the time of the consult, by health zone
Caveats/limitations:
- One facility in health zone 4 switched from paper charts to electronic format in September 2019. For this facility, only data for September onward were included for both the denominator and numerator.
- The COVID-19 pandemic may have affected service provision.
 Data source: Provincial cancer agencies and programs
Topic: Expanding models of care
Title of image: Percentage of new-to-institution patients attending a first consult who completed the patient reported outcomes tools at the time of the consult, by age group
Caveats/limitations: The COVID-19 pandemic may have affected service provision.
 Data source: Provincial cancer agencies and programs
Priority 4 Action 1: Provide better services and care adapted to the specific needs of underserved groups
Topic: Increasing access to culturally safe care
Title of image: Percentage of patients reporting that they were treated with dignity and respect during their cancer treatment
Caveats/limitations: The COVID-19 pandemic may have affected service provision.
 Data source: Ambulatory Oncology Patient Satisfaction Survey (AOPSS)
Topic: Increasing access to culturally safe care
Title of image: Percentage of patients reporting that they were treated with dignity and respect during their cancer treatment, by sex
Caveats/limitations: The COVID-19 pandemic may have affected service provision.
 Data source: Ambulatory Oncology Patient Satisfaction Survey (AOPSS)
Topic: Increasing access to culturally safe care
Title of image: Percentage of patients reporting that they were treated with dignity and respect during their cancer treatment, by age group
Caveats/limitations: The COVID-19 pandemic may have affected service provision.
 Data source: Ambulatory Oncology Patient Satisfaction Survey (AOPSS)
Topic: Increasing support to help patients navigate the system
Title of image: Percentage of patients with cancer living in rural/remote areas in AB who utilized the nurse navigator service
Caveats/limitations:
- The data presented reflects only the nurse navigator support in rural/remote geographies. Indigenous and AYA Nurse Navigators for patients residing in non-rural/non-remote are not included. Cancer patient navigation support is assigned based on the needs of the patient.
- Not all patients require direct care provided by a patient navigator. Navigation support at the two tertiary centres (Tom Baker Cancer Centre and Cross Cancer Institute) is provided by tumour triage coordinators and other health care providers and is not captured in these data.
- The COVID-19 pandemic may have affected service provision.
Data source: Provincial cancer agencies and programs
Priority 4 Action 2: Ensure rural and remote communities have the resources required to better serve their people
Topic: Increasing access to supportive care services
Title of image: Availability of supportive care services (i.e. psychosocial) in rural/remote areas, by fiscal year
Caveats/limitations: The COVID-19 pandemic may have affected service provision.
Data source: Provincial cancer agencies and programs
Priority 5 Action 1: Integrate the full spectrum of information and support services to ensure people are fully supported throughout the cancer experience
Topic: Improving availability of information and support
Title of image: Percentage of patients reporting that they received enough information about therapies for treating cancer
Caveats/limitations: The COVID-19 pandemic may have affected service provision.
 Data source: Ambulatory Oncology Patient Satisfaction Survey (AOPSS)
Topic: Improving availability of information and support
Title of image: Percentage of patients reporting that they received enough information about possible changes in their emotions, physical appearance and energy/fatigue levels
Caveats/limitations: The COVID-19 pandemic may have affected service provision.
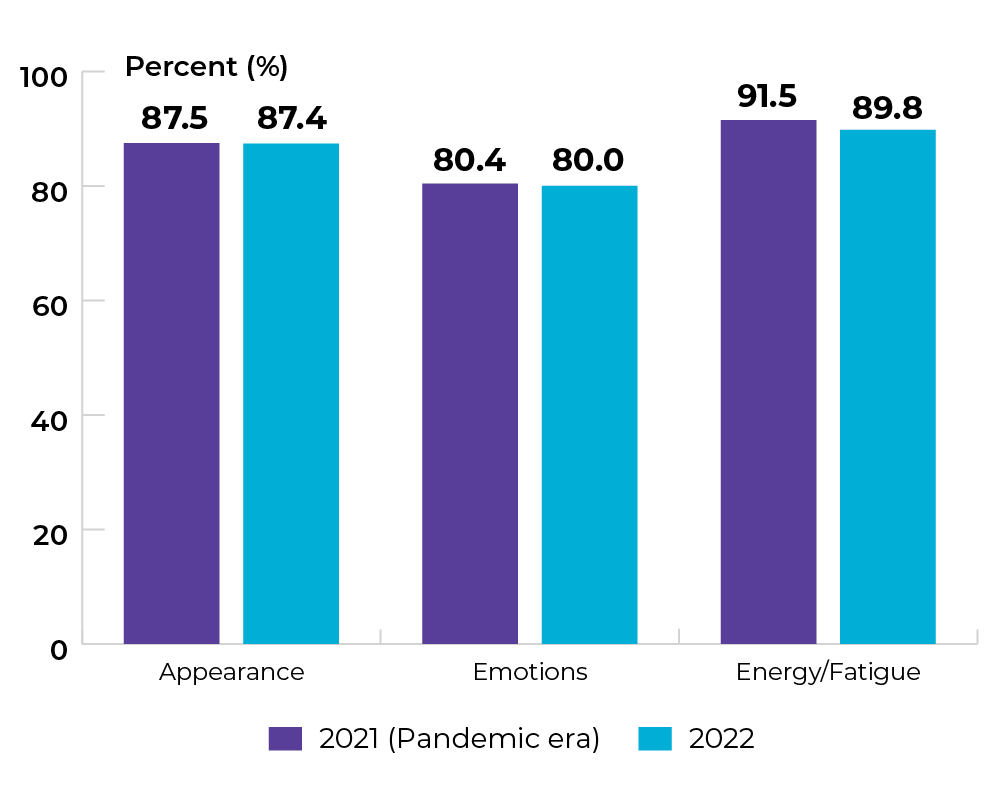
Data source: Ambulatory Oncology Patient Satisfaction Survey (AOPSS)
Topic: Improving availability of information and support
Title of image: Percentage of patients reporting that they were referred to a care provider who could help with anxieties and fears
Caveats/limitations: The COVID-19 pandemic may have affected service provision.
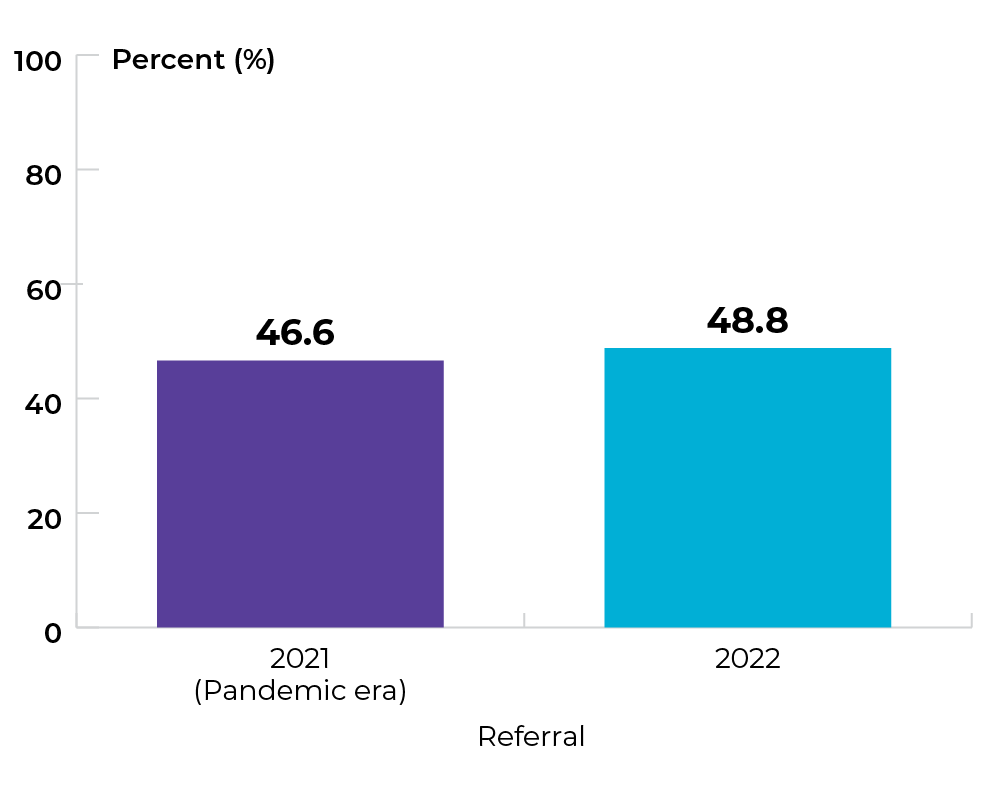
Data source: Ambulatory Oncology Patient Satisfaction Survey (AOPSS)
Priority 5 Action 2: Address the limited and unequal access to palliative and end-of-life care across Canada
Topic: Improving access to quality end-of-life care
Title of image: Cumulative length of stay for cancer patients (overall) who were in or admitted to an acute care hospital 30 days prior to death across AB for fiscal years 2015, 2017 and 2019
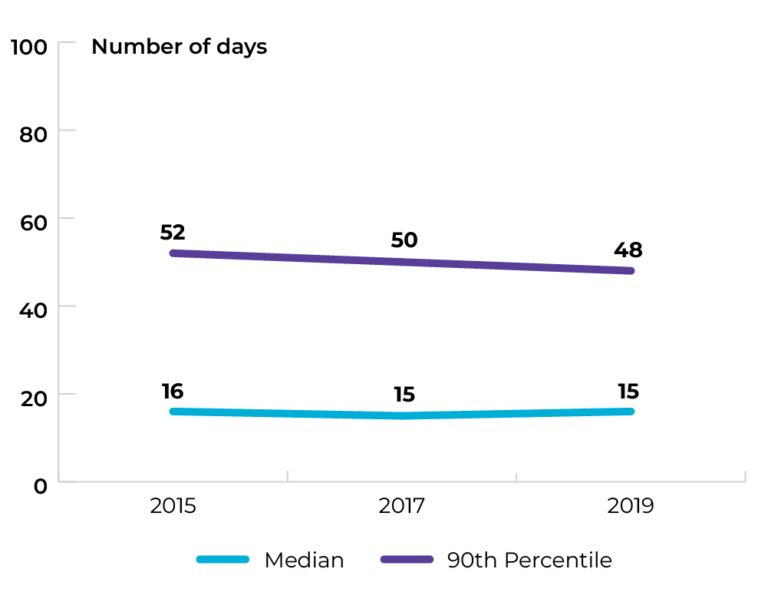
Data source: Canadian Institute for Health Information (CIHI), Discharge Abstract Database (DAD)
Topic: Improving access to quality end-of-life care
Title of image: Cumulative length of stay for cancer patients (rural/remote) who were in or admitted to an acute care hospital 30 days prior to death across AB for fiscal years 2015, 2017 and 2019
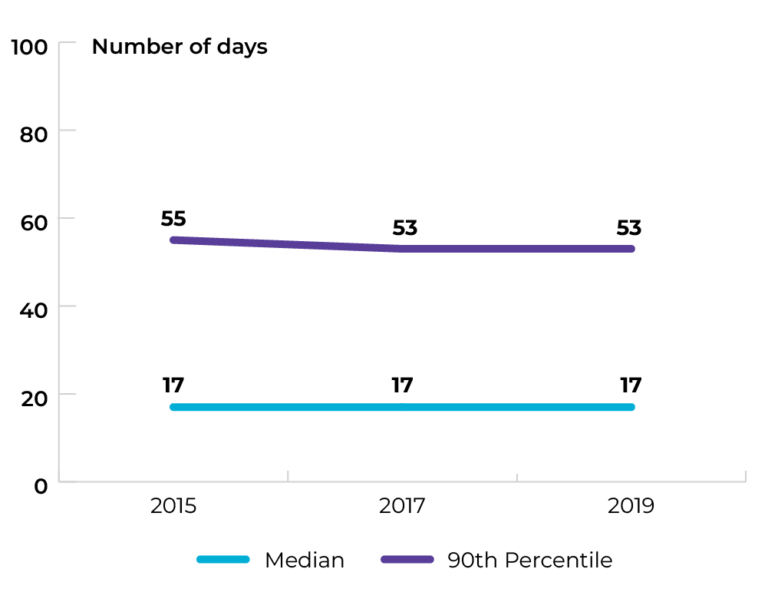
Data source: Canadian Institute for Health Information (CIHI), Discharge Abstract Database (DAD)
Topic: Improving access to quality end-of-life care
Title of image: Cumulative length of stay for cancer patients (urban) who were in or admitted to an acute care hospital 30 days prior to death across AB for fiscal years 2015, 2017 and 2019
Data source: Canadian Institute for Health Information (CIHI), Discharge Abstract Database (DAD)
The data tables and technical appendix for all indicators are available upon request at info@partnershipagainstcancer.ca. You will receive a response in two to three business days.