Supplementary data: Prince Edward Island
This page provides data visualizations related to the priorities for Canada’s cancer system.
The data tables and technical appendix for all indicators are available upon request at info@partnershipagainstcancer.ca.
Priority 1 Action 1: Help people to stop smoking or not start in the first place and live healthier lives
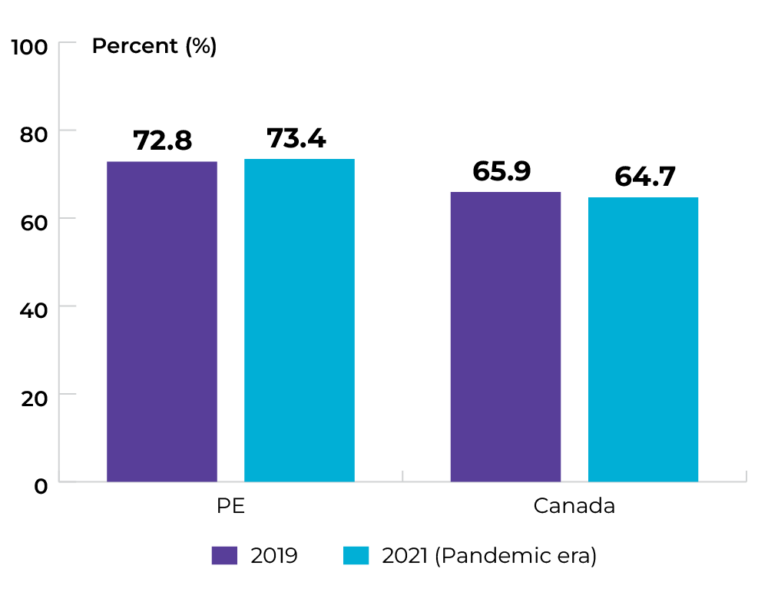
Topic: Keeping people smoke-free
Title of image: Percentage of individuals in PEI (aged ≥ 12) classified as daily or occasional smokers
Caveats/limitations:
- This indicator was reported using the Canadian Community Health Survey (CCHS).
- Individuals who did not respond to the required CCHS questions regarding smoking status were not included in the analysis.
- The COVID-19 pandemic had major impacts on the data collection operations and response rates for this survey.
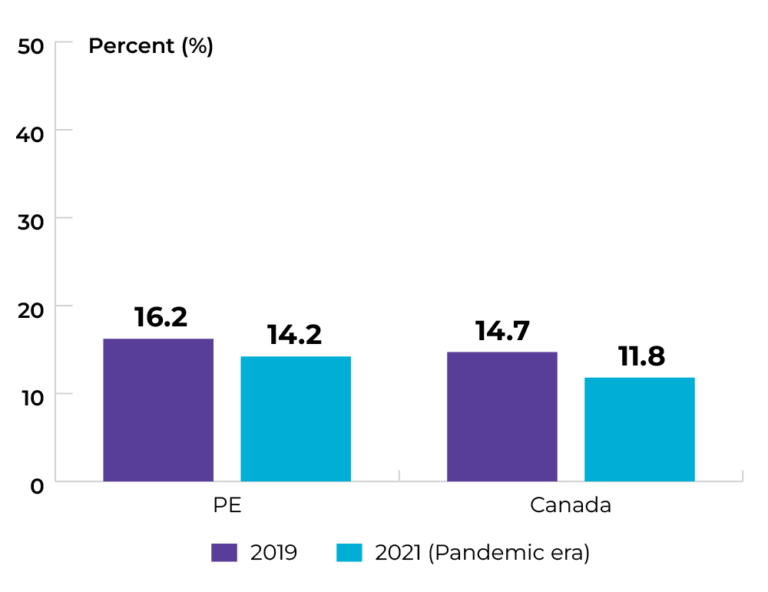
Data source: Canadian Community Health Survey
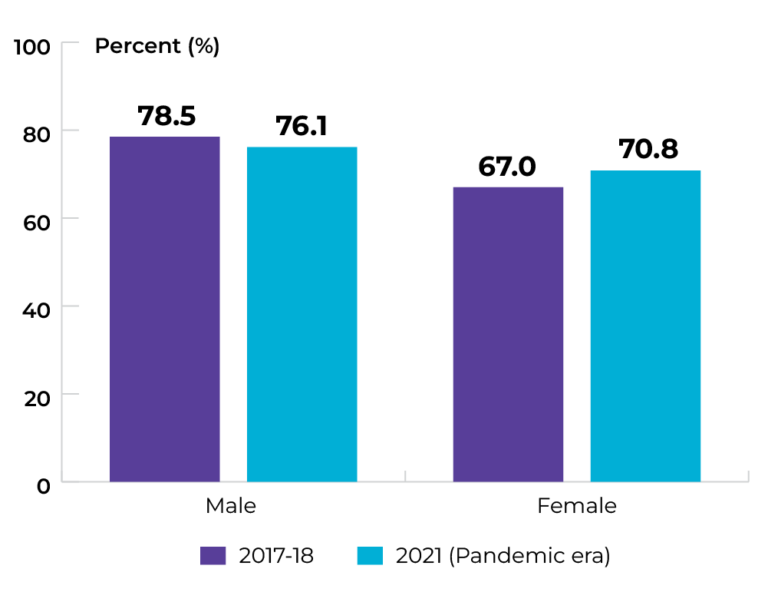
Topic: Keeping people smoke-free
Title of image: Percentage of individuals in PEI (aged ≥ 12) classified as daily or occasional smokers, by sex
Caveats/limitations:
- The COVID-19 pandemic had major impacts on the data collection operations and response rates for this survey.
- Interpret with caution owing to large variability in the 2021 estimates.
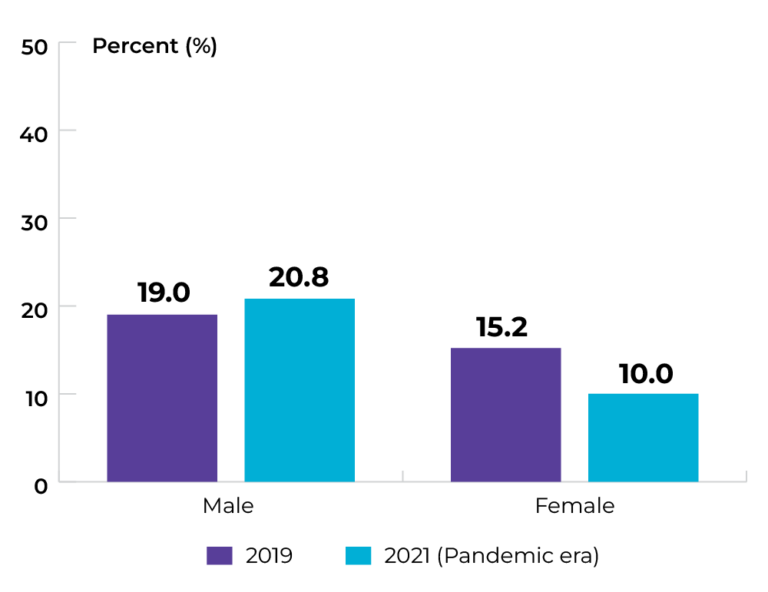 Data source: Canadian Community Health Survey
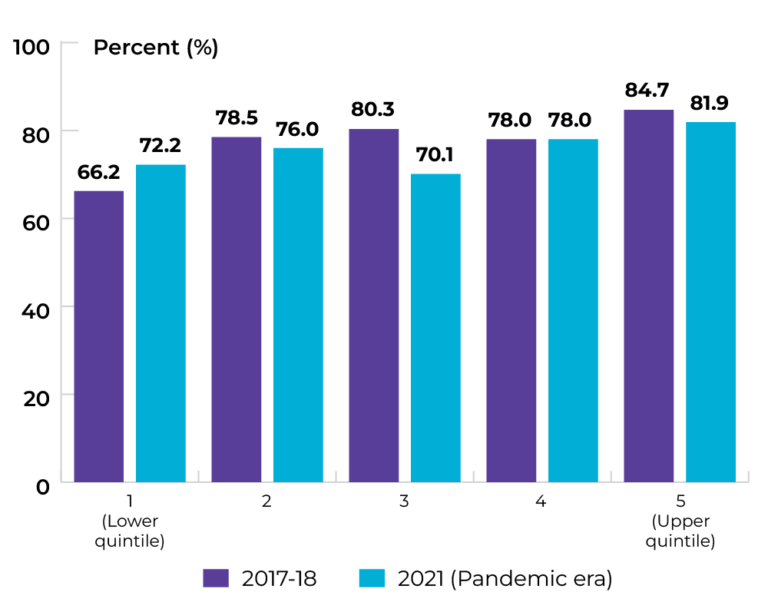
Topic: Keeping people smoke-free
Title of image: Percentage of individuals in PEI (aged ≥ 18) classified as daily or occasional smokers, by household income quintile
Caveats/limitations:
- The COVID-19 pandemic had major impacts on the data collection operations and response rates for this survey.
- Interpret with caution owing to large variability in the 2021 estimates.
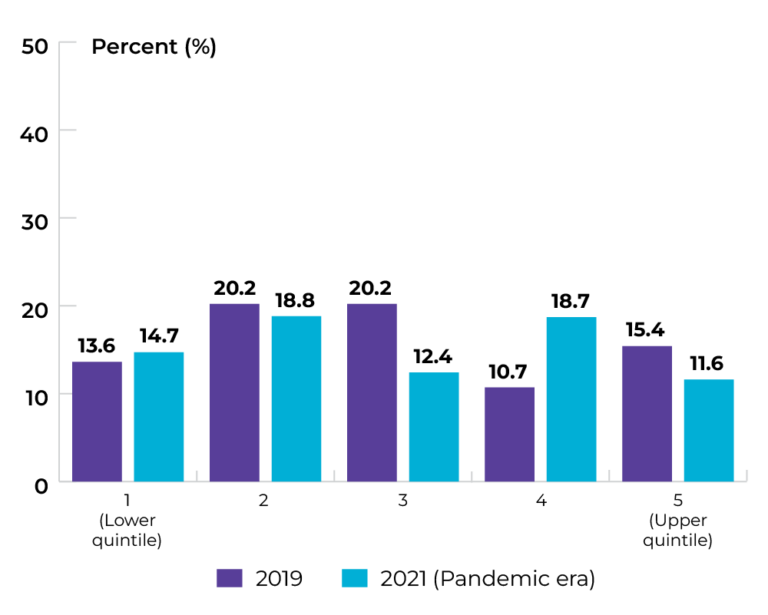 Data source: Canadian Community Health Survey
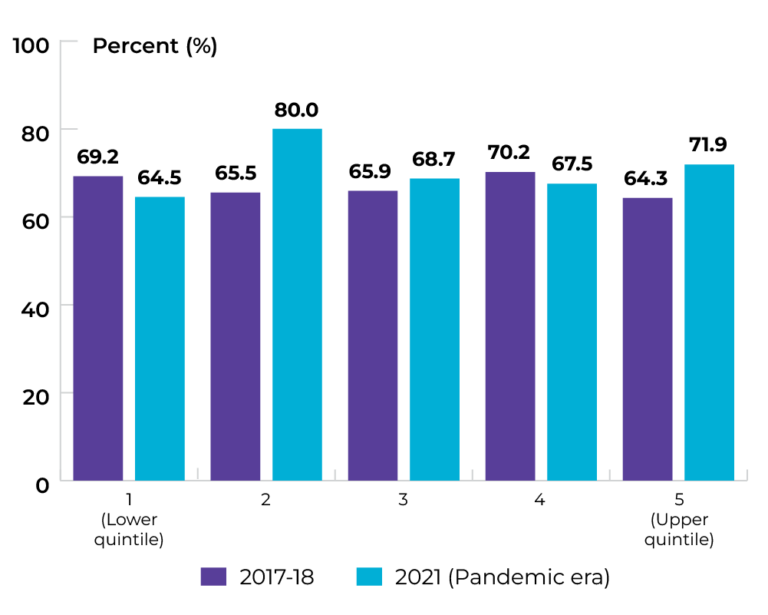
Topic: Keeping people smoke-free
Title of image: Percentage of individuals in PEI (aged ≥ 18) classified as daily or occasional smokers, by highest level of education
Caveats/limitations:
- The COVID-19 pandemic had major impacts on the data collection operations and response rates for this survey.
- Interpret with caution owing to large variability in the 2021 estimates.
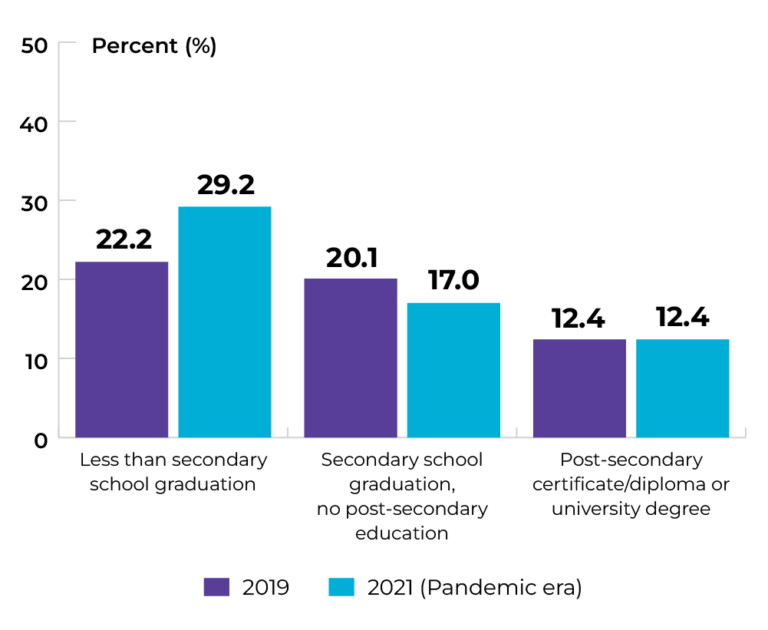 Data source: Canadian Community Health Survey
Topic: Maintaining healthy body weight
Title of image: Percentage of individuals in PEI (aged ≥ 18) classified as overweight or obese
Caveats/limitations: The COVID-19 pandemic had major impacts on the data collection operations and response rates for this survey.
Data source: Canadian Community Health Survey
Topic: Maintaining healthy body weight
Title of image: Percentage of individuals in PEI (aged ≥ 18) classified as overweight or obese, by sex
Caveats/limitations: The COVID-19 pandemic had major impacts on the data collection operations and response rates for this survey.
Data source: Canadian Community Health Survey
Topic: Maintaining healthy body weight
Title of image: Percentage of males in PEI (aged ≥ 18) classified as overweight or obese, by income quintile
Caveats/limitations: The COVID-19 pandemic had major impacts on the data collection operations and response rates for this survey
Data source: Canadian Community Health Survey
Topic: Maintaining healthy body weight
Title of image: Percentage of females in PEI (aged ≥ 18) classified as overweight or obese, by income quintile
Caveats/limitations: The COVID-19 pandemic had major impacts on the data collection operations and response rates for this survey
Data source: Canadian Community Health Survey
Priority 1 Action 2: Adopt proven practices known to reduce the risk of cancer
Topic: Increasing HPV vaccination
Title of image: Percentage of students aged 12 completely vaccinated* for HPV in PEI
*Complete vaccination = Three doses for ages 12+ before 2015. From 2015, only two doses = Complete vaccination
Caveats/limitations: The COVID-19 pandemic may have affected service provision.
Data source: Provincial cancer agencies and programs
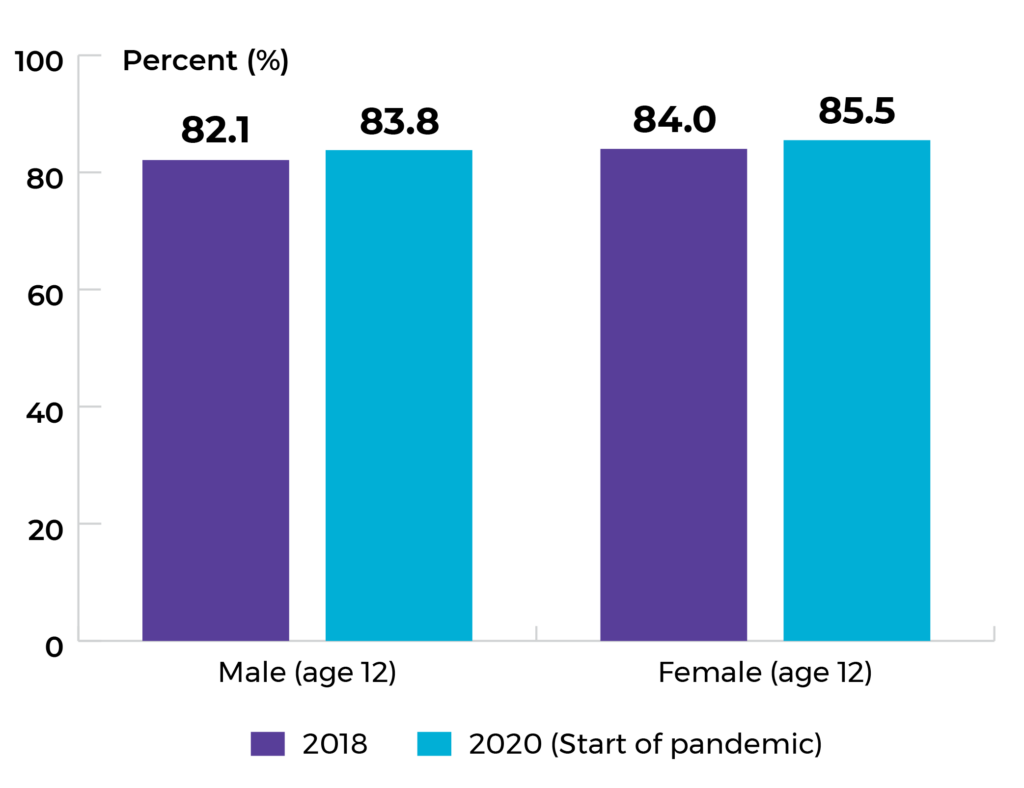
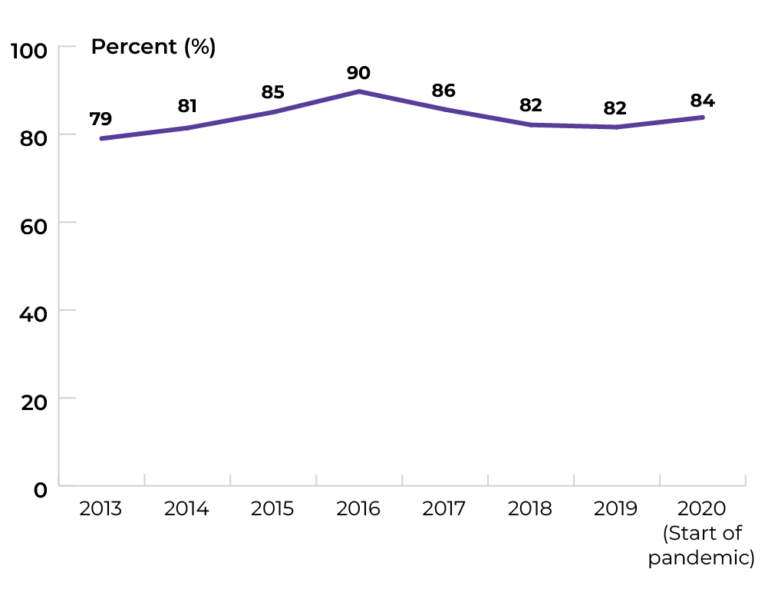
Topic: Increasing HPV vaccination
Title of image: Percentage of Grade 6 males completely vaccinated* for HPV in PEI, by year of vaccination
*Complete vaccination = Three doses for ages 12+ before 2015. From 2015, only two doses = Complete vaccination
Caveats/limitations: The COVID-19 pandemic may have affected service provision.
 Data source: Provincial cancer agencies and programs
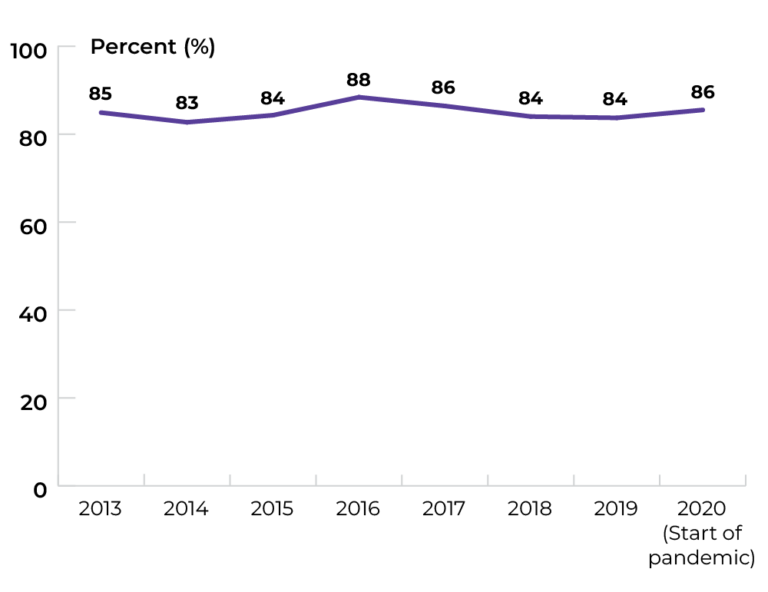
Topic: Increasing HPV vaccination
Title of image: Percentage of Grade 6 females completely vaccinated* for HPV in PEI, by year of vaccination
*Complete vaccination = Three doses for ages 12+ before 2015. From 2015, only two doses = Complete vaccination
Caveats/limitations: The COVID-19 pandemic may have affected service provision.
 Data source: Provincial cancer agencies and programs
Topic: Increasing genetic testing
Title of image: Percentage of PEI patients with breast, colorectal and ovarian cancer who received genetic testing
Caveats/limitations:
- According to the guidelines for genetic testing, all women with ovarian cancer are eligible for genetic testing, while only a subgroup of women with breast cancer and a subcategory of people with colorectal cancer are eligible for genetic testing.
- The COVID-19 pandemic may have affected service provision.
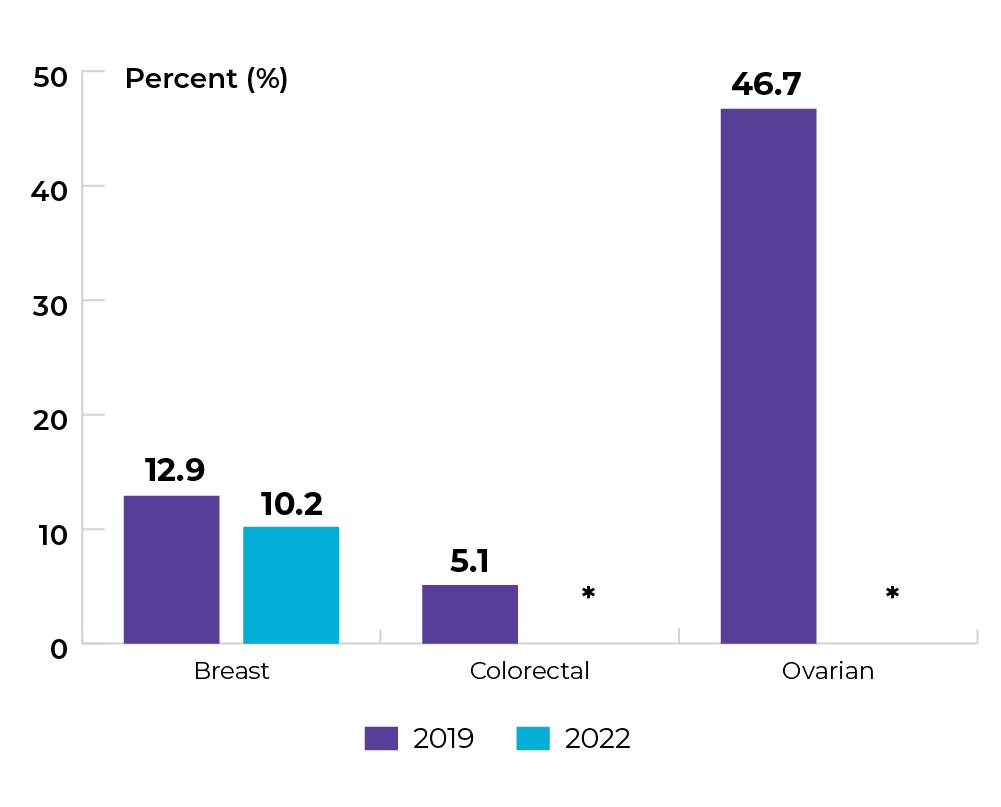
*Suppressed owing to small numbers
Data source: Provincial cancer agencies and program
Priority 2 Action 1: Prioritize rapid access to appropriate diagnosis for those suspected of having cancer
Topic: Reducing wait for diagnosis
Title of image: Wait time (days) from suspicion of breast cancer to time of diagnosis in PEI
Caveats/limitations:
- For women who had more than one cancer diagnosed in the year, only the earliest cancer was kept.
- The COVID-19 pandemic may have affected service provision.
 Data source: Provincial cancer agencies and programs
Topic: Diagnosing cancer earlier
Title of image: Proportion of stage 4 or later stage cancer diagnosis in PEI
Caveats/limitations: The COVID-19 pandemic may have affected service provision.
Data source: Provincial cancer agencies and programs
Priority 2 Action 2: Strengthen existing screening efforts and implement lung cancer screening programs across the country
Topic: Increasing participation in colorectal cancer screening
Title of image: Percentage of people in PEI who had a FIT test in the past 2.5 years or had a sigmoidoscopy or colonoscopy in the past 10 years
Caveats/limitations: The COVID-19 pandemic may have affected service provision.
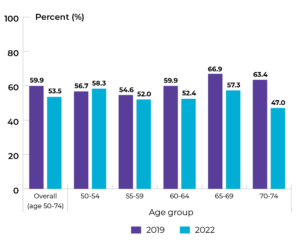 Data source: Provincial cancer agencies and programs
Priority 3 Action 1: Set best practices and standards for care delivery and promote their adoption
Topic: Implementing multidisciplinary care for pediatric cancer patients
Title of image: Percentage of pediatric patients in PEI not treated in the adult cancer treatment centre who were discussed at the multidisciplinary discussions
Caveats/limitations: The COVID-19 pandemic may have affected service provision.
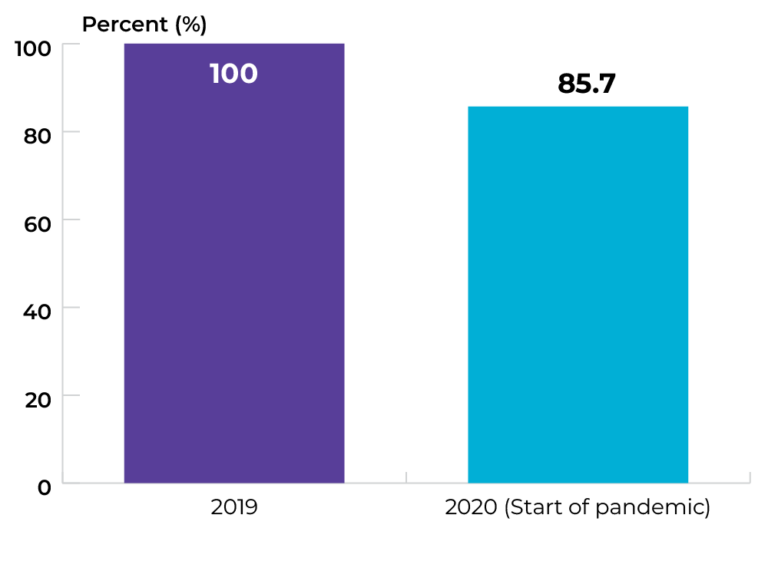 Data source: Provincial cancer agencies and programs
Topic: Implementing multidisciplinary care for rectal cancer patients
Title of image: Percentage of adult patients with rectal cancer in PEI discussed at multidisciplinary rounds or discussions
Caveats/limitations: The COVID-19 pandemic may have affected service provision.
Data source: Provincial cancer agencies and programs
Priority 3 Action 2: Eliminate low-benefit practices and adopt high-value practices
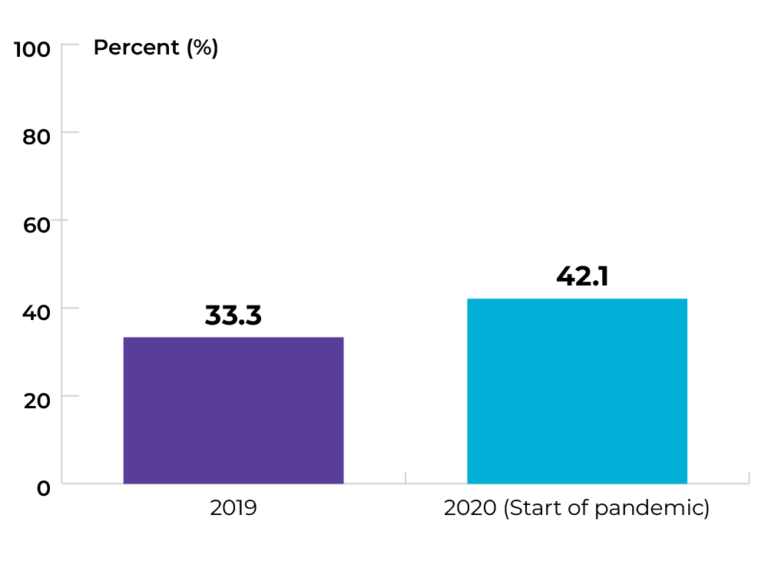
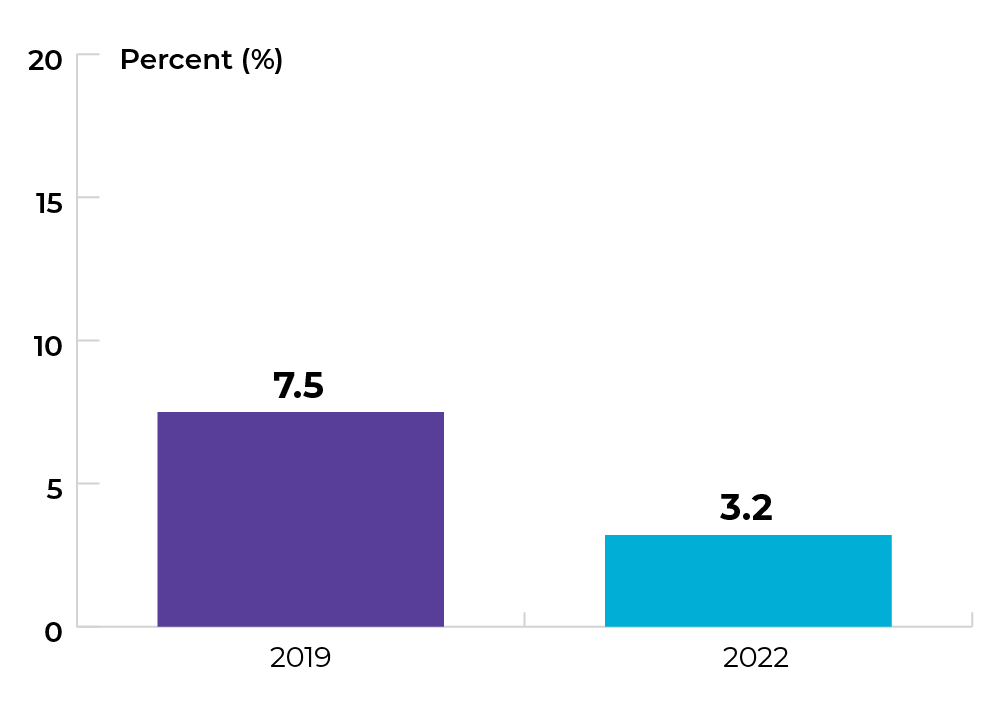
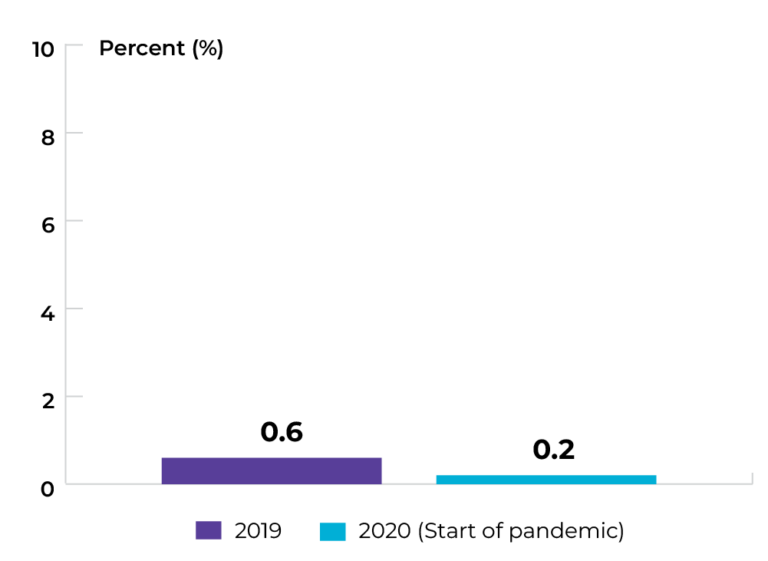
Topic: Optimizing care at end of life
Title of image: Percentage of patients with cancer who received systemic therapy in the last two weeks of life
Caveats/limitations: The COVID-19 pandemic may have affected service provision.
 Data source: Provincial cancer agencies and programs
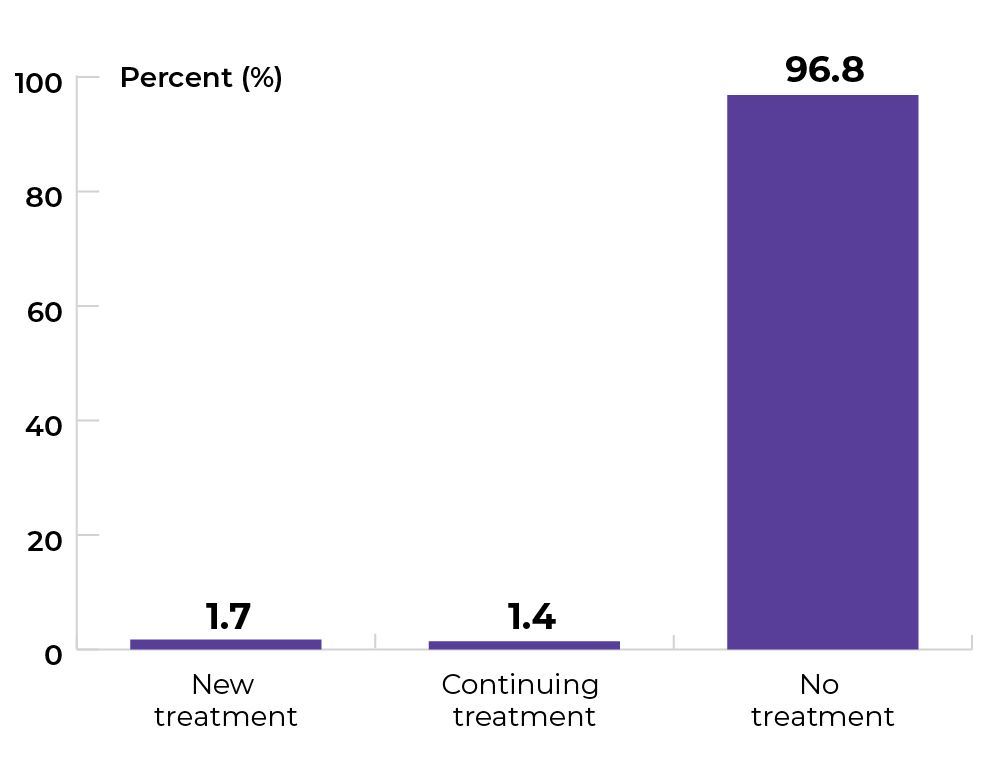
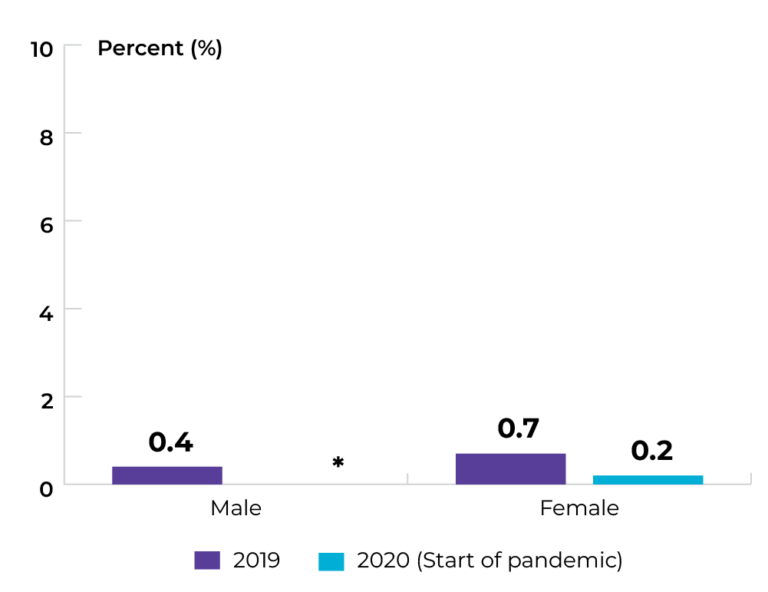
Topic: Optimizing care at end of life
Title of image: Percentage of patients with cancer who received systemic therapy in the last two weeks of life in 2022, by treatment type
Caveats/limitations:
- Denominator is all deaths among patients with cancer, not specifically deaths due to cancer.
- The COVID-19 pandemic may have affected service provision.
Data source: Provincial cancer agencies and programs
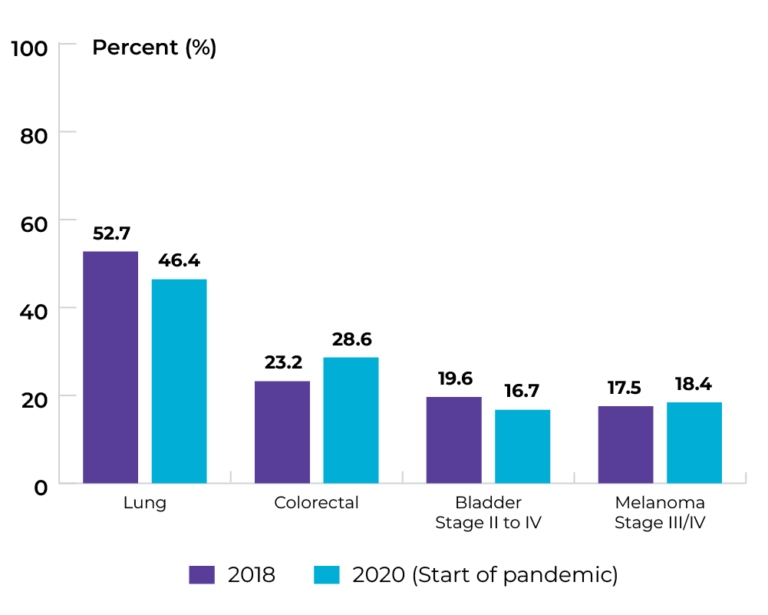
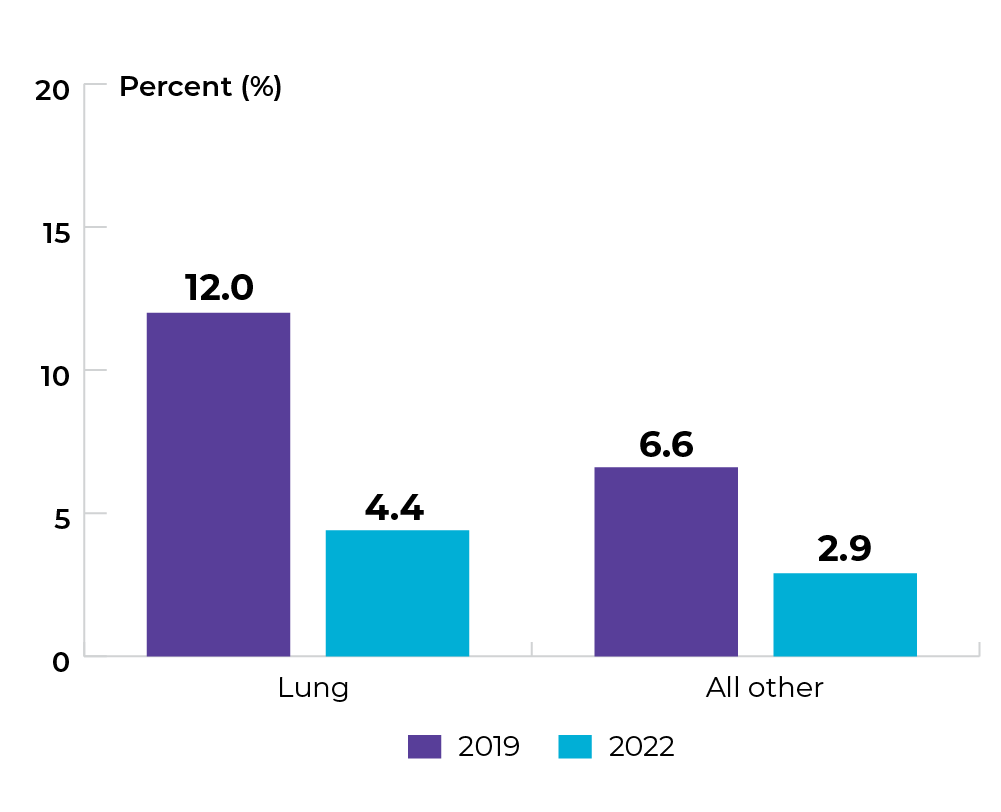
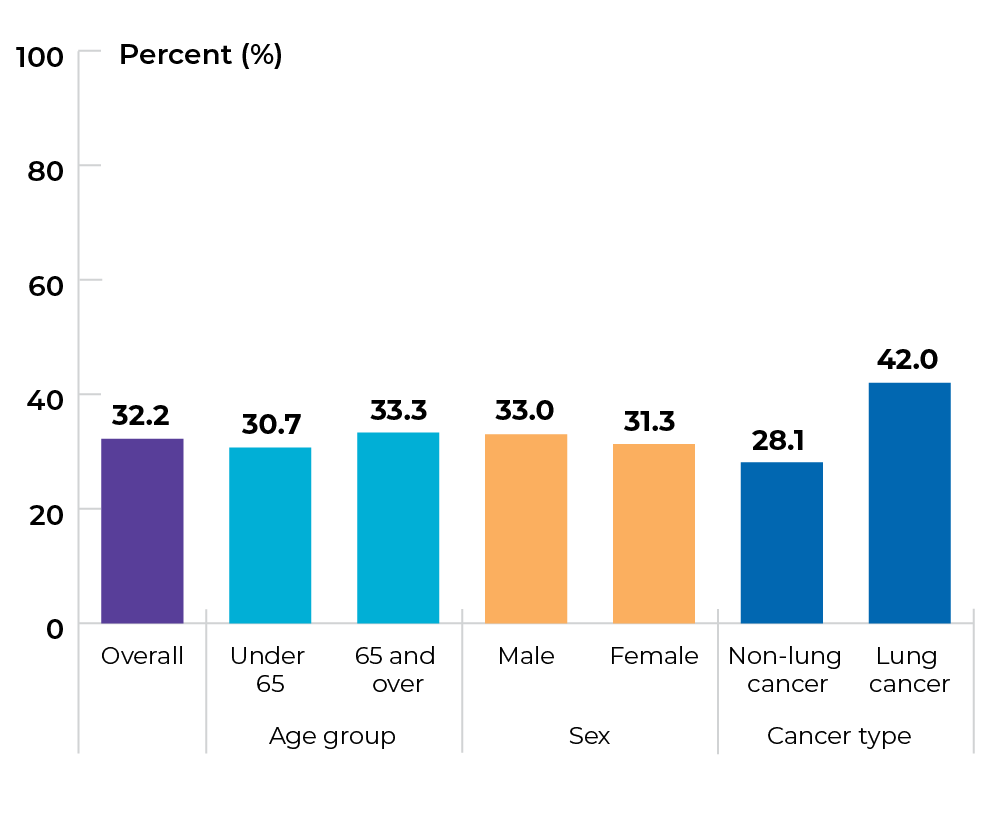
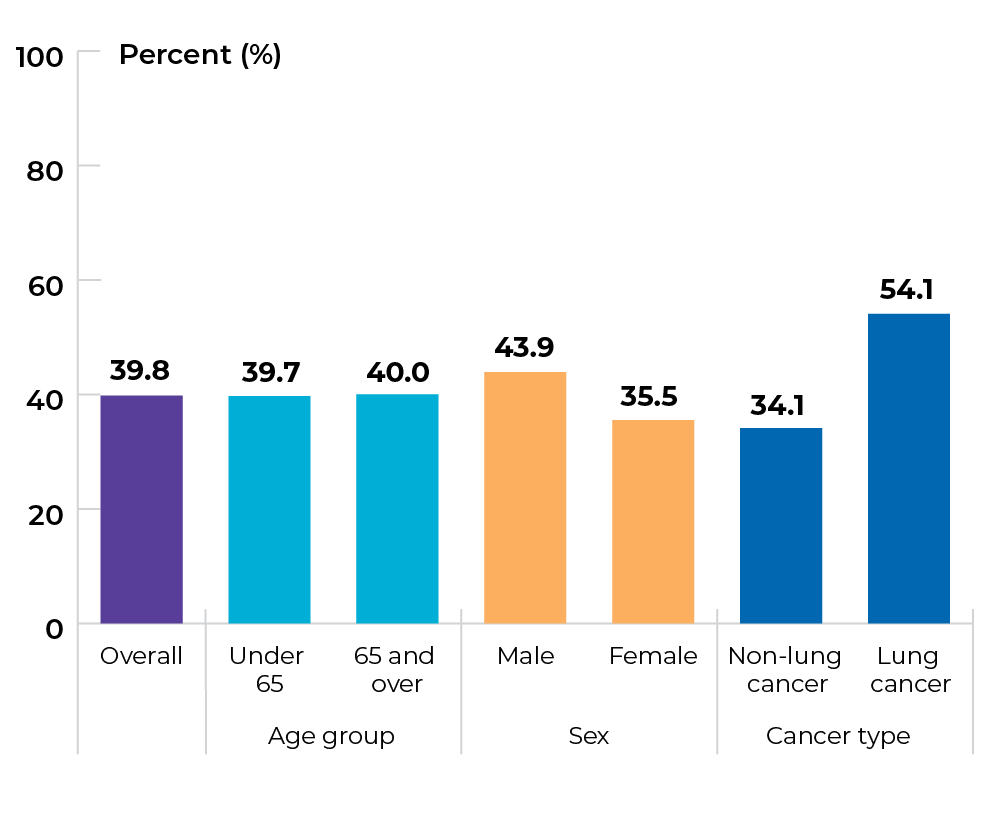
Topic: Optimizing care at end of life
Title of image: Percentage of patients with cancer who received systemic therapy in the last two weeks of life, by cancer type
Caveats/limitations:
- Denominator is all deaths among patients with cancer, not specifically deaths due to cancer.
- The COVID-19 pandemic may have affected service provision.
Data source: Provincial cancer agencies and programs
Topic: Optimizing care at end of life
Title of image: Percentage of patients with cancer who received systemic therapy in the last two weeks of life, by age at death
Caveats/limitations:
- Denominator is all deaths among patients with cancer, not specifically deaths due to cancer.
- The COVID-19 pandemic may have affected service provision.
Data source: Provincial cancer agencies and programs
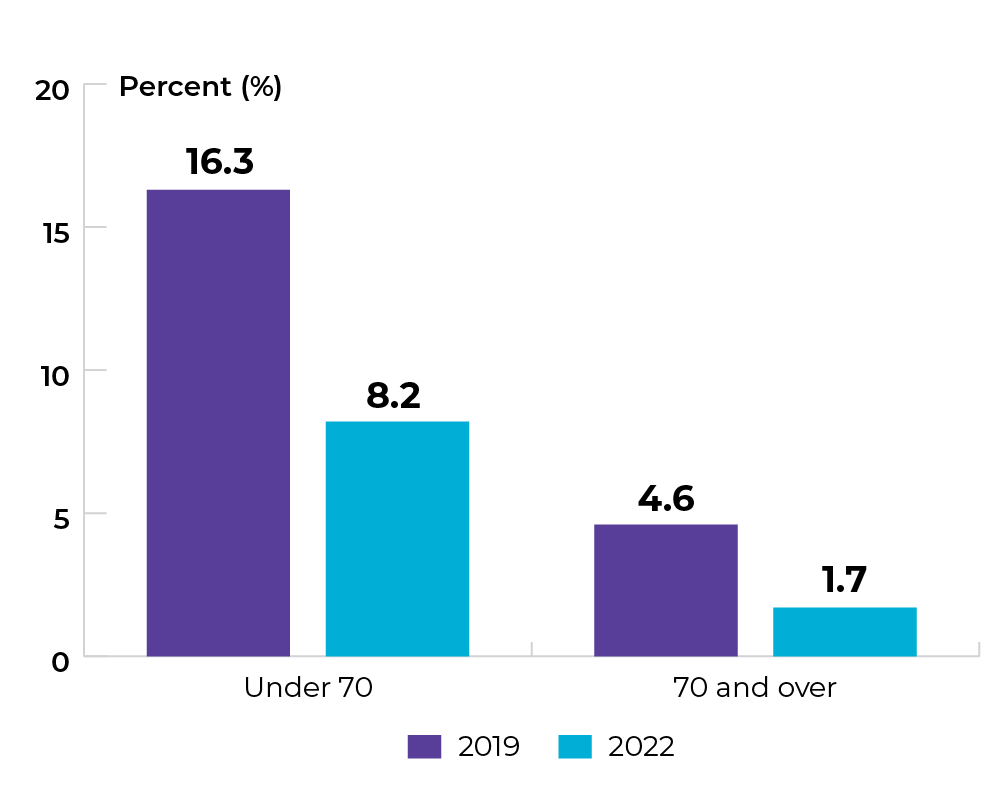
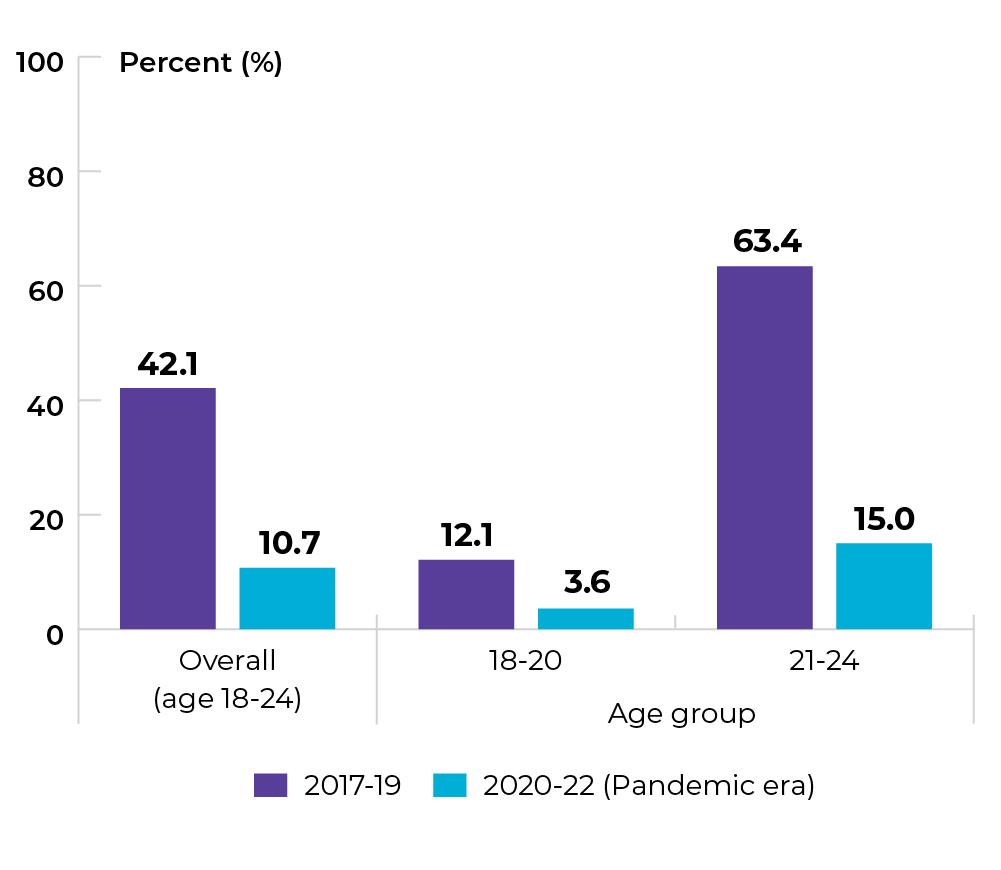
Topic: Optimizing screening and appropriate follow-up
Title of image: Percentage of people with a cervix aged 18-24 who had a Pap test
Caveats/limitations:
- Individuals with cervical cancer or hysterectomies were not excluded.
- Up until 2020, the age for screening started at 21 years old. In 2020, the age to start screening was changed to 25 years old.
- The COVID-19 pandemic may have affected service provision.
 Data source: Provincial cancer agencies and programs
Priority 3 Action 3: Design and implement new models of care
Topic: Expanding models of care
Title of image: Percentage of total tobacco users (people who have used tobacco in the last 6 months) who participated in a tobacco cessation service after being screened at a PEI ambulatory cancer treatment centre between April 1, 2022 and March 31, 2023
Caveats/limitations: The COVID-19 pandemic may have affected service provision.
Data source: Provincial cancer agencies and programs
Topic: Expanding models of care
Title of image: Percentage of current tobacco users (people who have used tobacco in the last 7 days) who participated in a tobacco cessation service after being screened at a PEI ambulatory cancer treatment centre between April 1, 2022 and March 31, 2023
Caveats/limitations: The COVID-19 pandemic may have affected service provision.
Data source: Provincial cancer agencies and programs
Priority 4 Action 1: Provide better services and care adapted to the specific needs of underserved groups
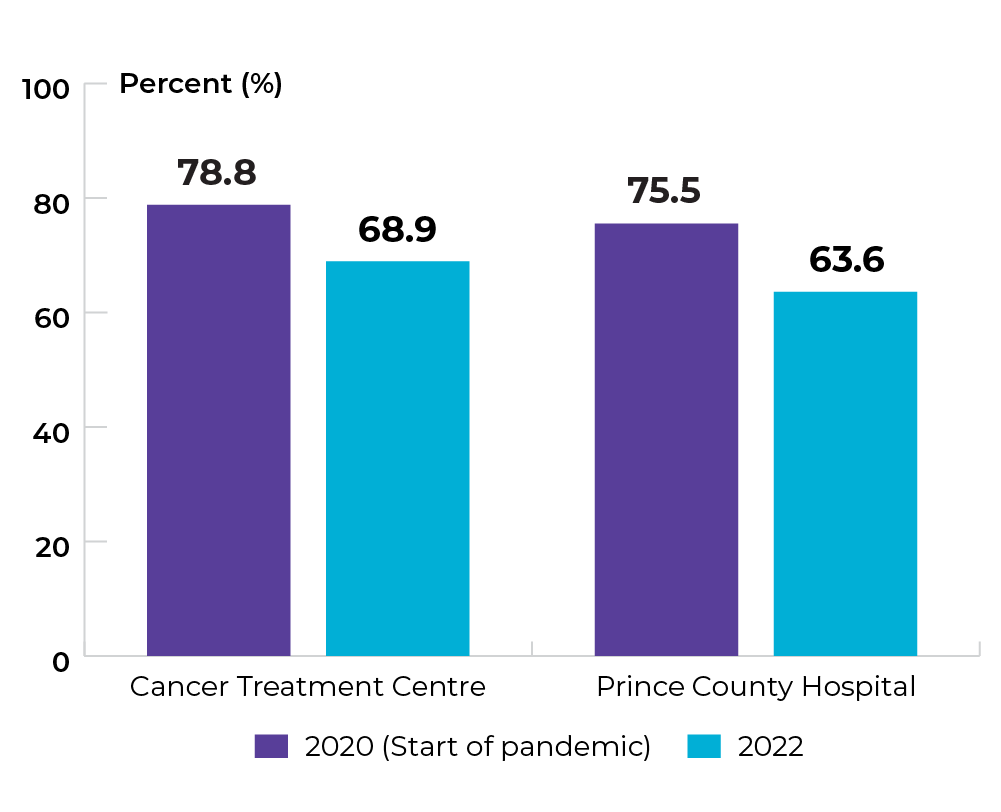
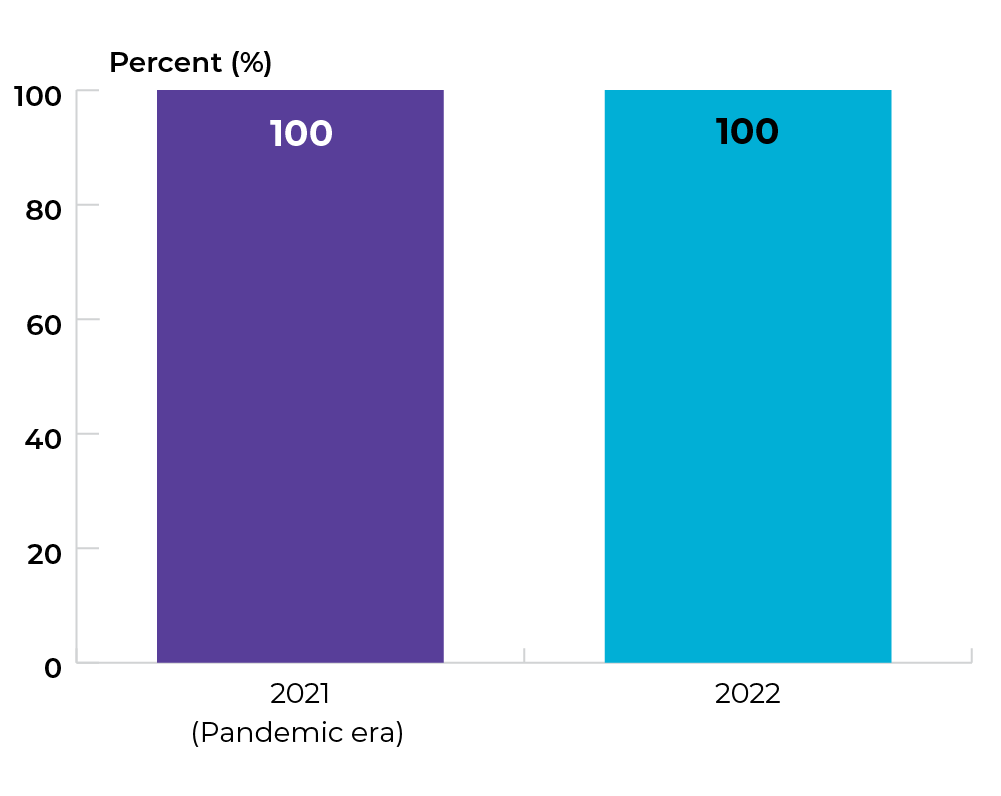
Topic: Increasing access to culturally safe care
Title of image: Percentage of patients who feel they were treated with courtesy and respect
Caveats/limitations: The COVID-19 pandemic may have affected service provision.
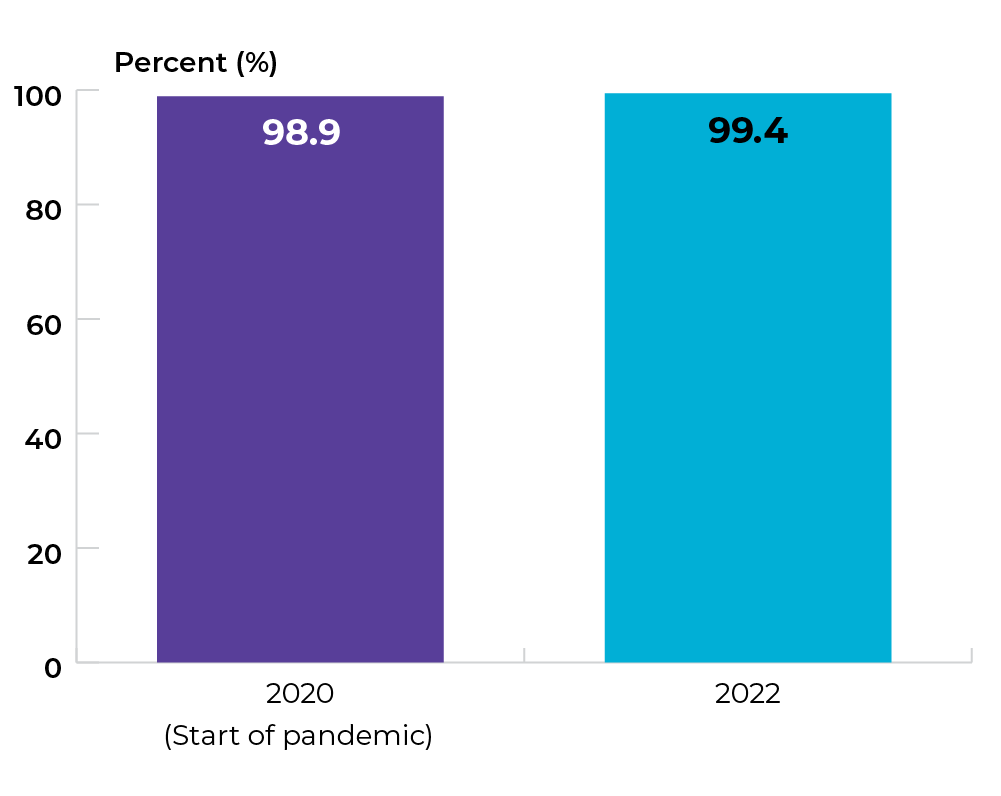 Data source: PEI Ambulatory Care Patient Satisfaction Survey
Topic: Increasing access to culturally safe care
Title of image: Percentage of patients who feel they were treated with courtesy and respect, by location
Caveats/limitations: The COVID-19 pandemic may have affected service provision.
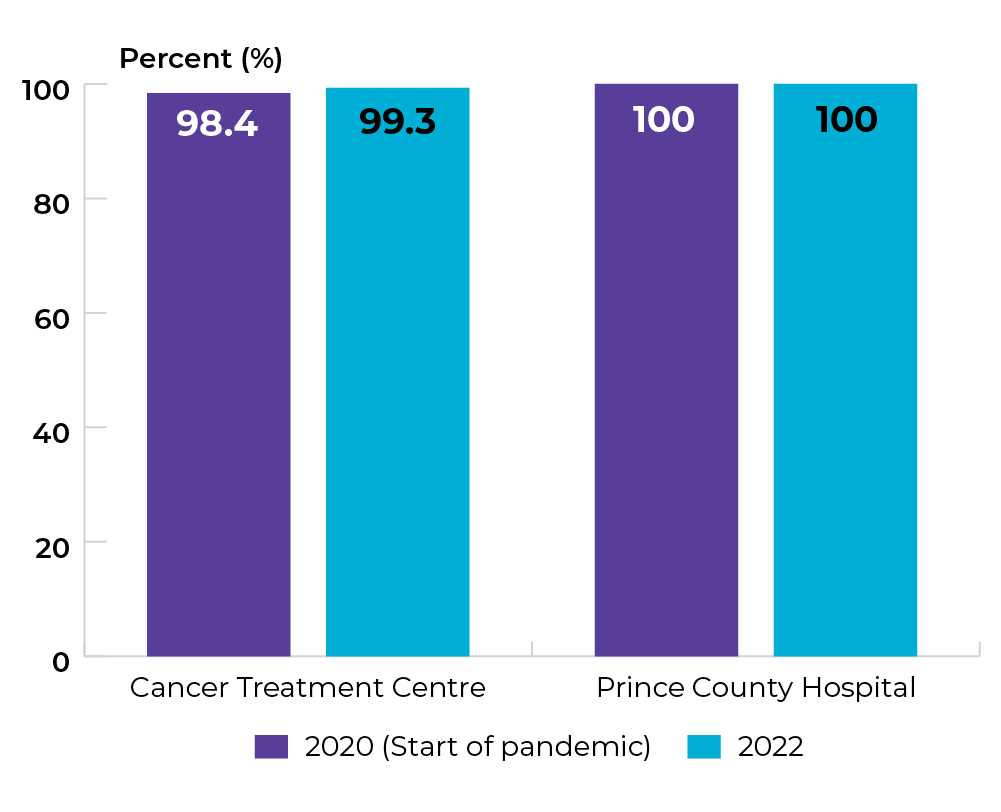
Data source: PEI Ambulatory Care Patient Satisfaction Survey
Priority 4 Action 2: Ensure rural and remote communities have the resources required to better serve their people
Topic: Increasing access to virtual care
Title of image: Percentage of patients with cancer who had any out of province virtual appointments
Caveats/limitations:
- All the virtual out of province appointments conducted with PEI cancer patients participating at a PEI hospital were measured. It was difficult to recognize if the appointment was for treatment or for diagnosis.
- The COVID-19 pandemic may have affected service provision.
 Data source: Provincial cancer agencies and programs
Topic: Increasing access to virtual care
Title of image: Percentage of patients with cancer who had any out of province virtual appointments, by sex
Caveats/limitations: The COVID-19 pandemic may have affected service provision.
*Suppressed owing to small numbers.
Data source: Provincial cancer agencies and programs
Topic: Increasing access to virtual care
Title of image: Percentage of patients with cancer who had any out of province virtual appointments, by age group
Caveats/limitations: The COVID-19 pandemic may have affected service provision.
Note: *Suppressed owing to small numbers.
Data source: Provincial cancer agencies and programs
Topic: Increasing access to virtual care
Title of image: Percentage of patients with cancer who had any out of province virtual appointments, by residence
Caveats/limitations: The COVID-19 pandemic may have affected service provision.
Data source: Provincial cancer agencies and programs
Priority 4 Action 3: Ensure care can be delivered between provinces, territories and federal jurisdictions when needed
Topic: Improving access to timely care for people who need to travel between jurisdictions
Title of image: Wait time (in days) for patients with cancer who require cancer treatment outside of their home jurisdiction
Caveats/limitations:
- Patients who had their referral request date after the treatment date (due to delayed referral request) were excluded from the analysis.
- Sometimes, it is not clear if the referral was for diagnostic procedure or for treatment; hence if the date of referral was before the date of diagnosis, it was likely for diagnostic purposes.
- Some wait times were extended because the patients were receiving preparatory treatment in the form of chemotherapy or radiotherapy before their out of province appointment.
- The COVID-19 pandemic may have affected service provision.
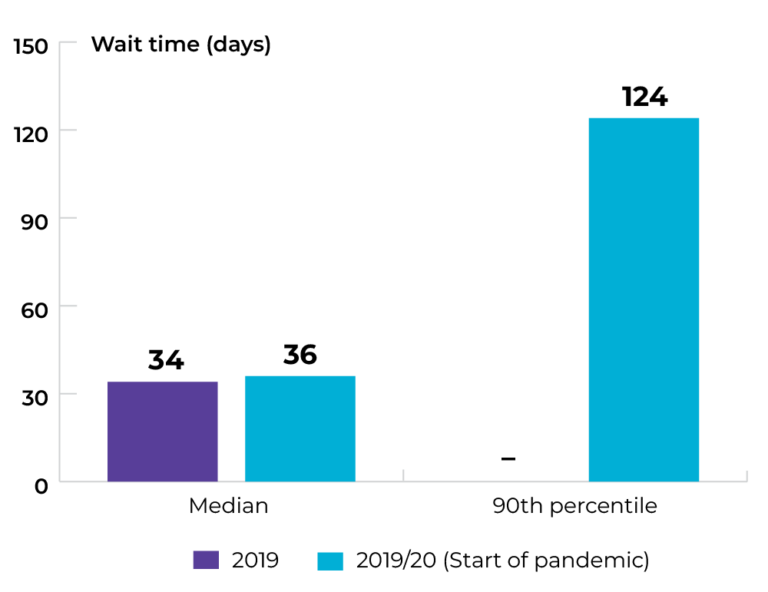
Note: – Data not available.
Data source: Provincial cancer agencies and programs
Topic: Improving access to timely care for people who need to travel between jurisdictions
Title of image: Wait time (in days) for patients with cancer who require cancer treatment outside of their home jurisdiction, by sex
Caveats/limitations: The COVID-19 pandemic may have affected service provision.
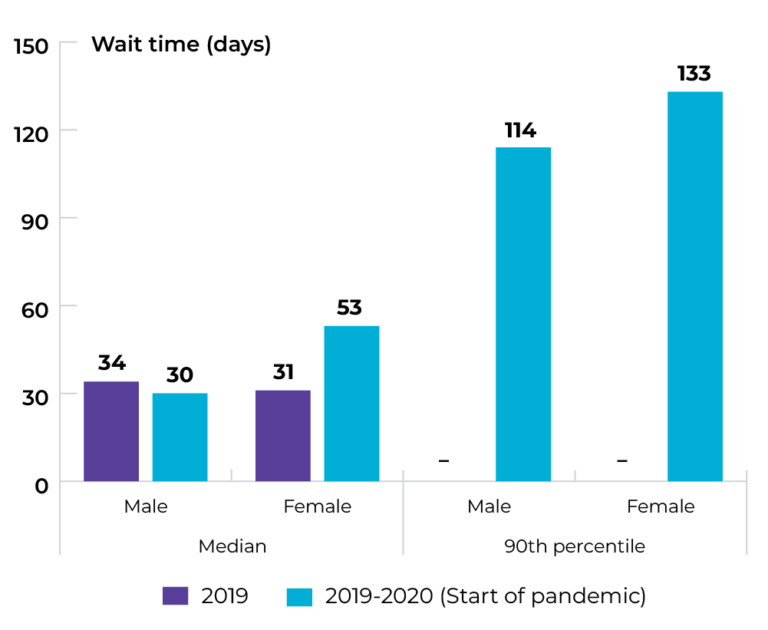
Note: – Data not available.
Data source: Provincial cancer agencies and programs
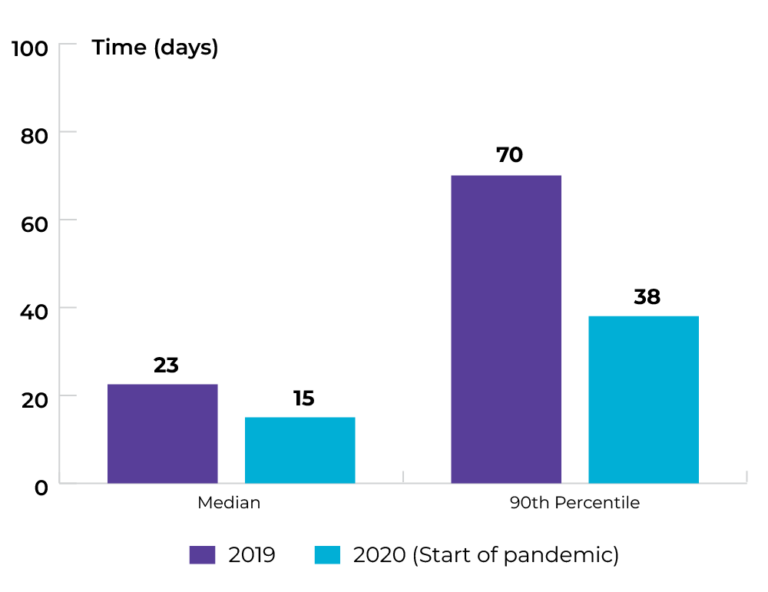
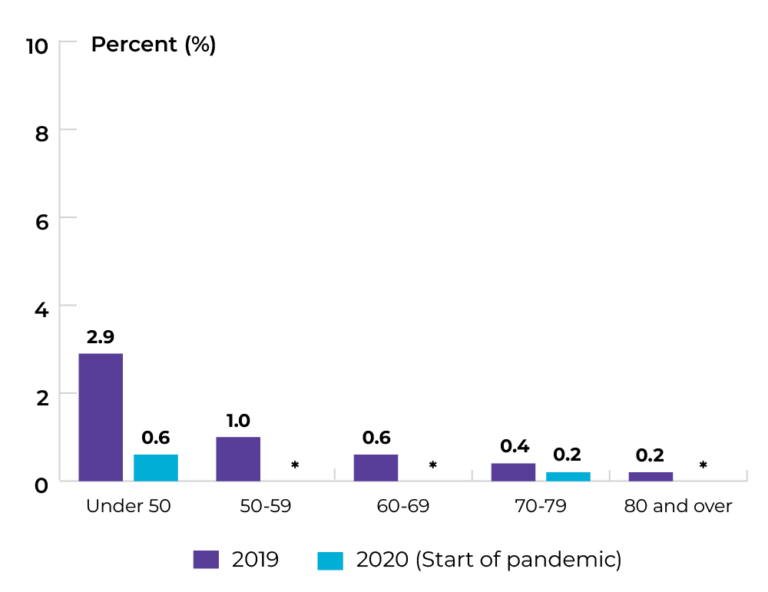
Topic: Improving access to timely care for people who need to travel between jurisdictions
Title of image: Median wait time (in days) for patients with cancer who require cancer treatment outside of their home jurisdiction, by age group
Caveats/limitations: The COVID-19 pandemic may have affected service provision.
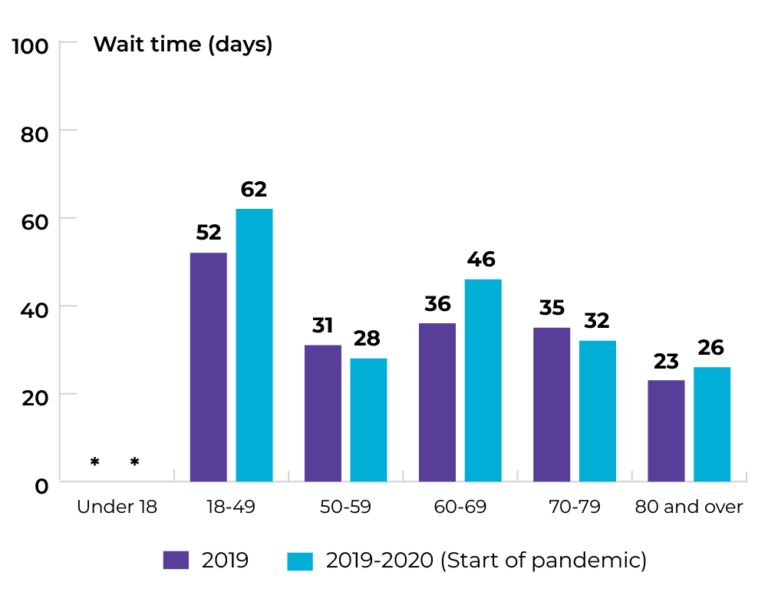 Note: *Suppressed owing to small numbers.
Data source: Provincial cancer agencies and programs
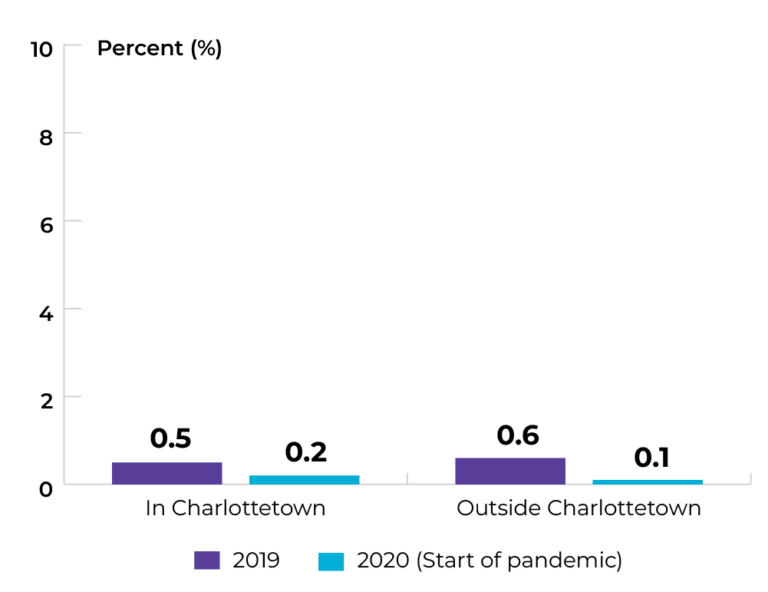
Topic: Improving access to timely care for people who need to travel between jurisdictions
Title of image: Wait time (90th percentile, in days) for patients with cancer who require cancer treatment outside of their home jurisdiction in 2019-2020, by age group
Caveats/limitations: The COVID-19 pandemic may have affected service provision.
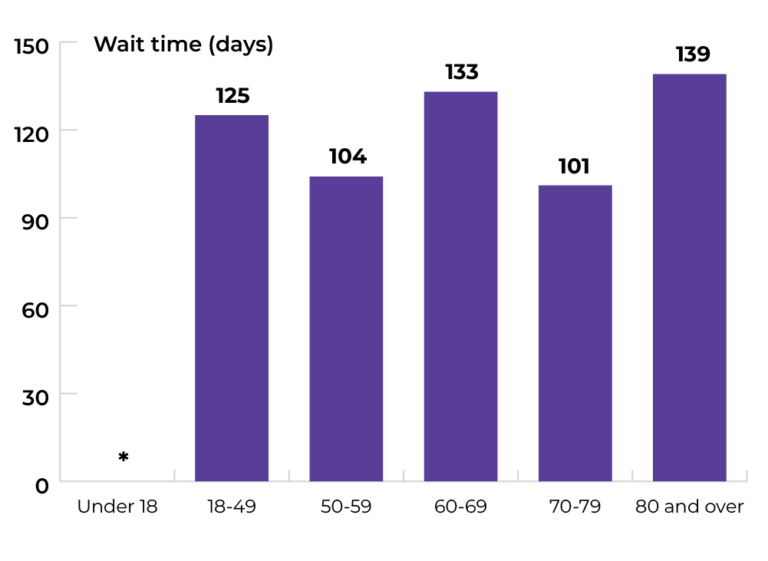 Note: *Suppressed owing to small numbers.
Data source: Provincial cancer agencies and programs
Topic: Improving access to transportation and general support for those needing to travel between jurisdictions
Title of image: Percentage of all PE patients with cancer with out of province appointments who were awarded transportation support in bus tickets, bridge or ferry passes, and plane tickets
Caveats/limitations:
- The denominator included all patients in the cancer registry with an out-of-province appointments with cancer diagnoses. The exact reason(s) the patient went to this appointment cannot be checked so it was assumed that it was for cancer diagnosis or treatment.
- There are other transportation supports for cancer patients provided by the Canadian Cancer Society (CCS) in Prince Edward Island according to the eligibility criteria of the CCS. This helps in reducing the burden of transportation needs.
- The COVID-19 pandemic may have affected service provision.
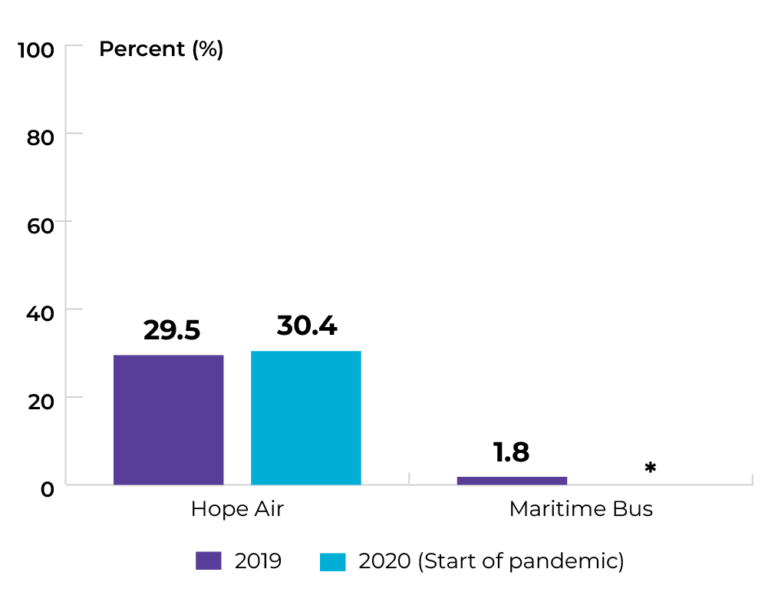
Note: *Suppressed owing to small numbers.
Data source: Provincial cancer agencies and programs
Priority 5 Action 1: Integrate the full spectrum of information and support services to ensure people are fully supported throughout the cancer experience
Topic: Improving availability of information and support
Title of image: Percentage of patients who feel staff told them about other services and supports available in the community
Caveats/limitations: The COVID-19 pandemic may have affected service provision.
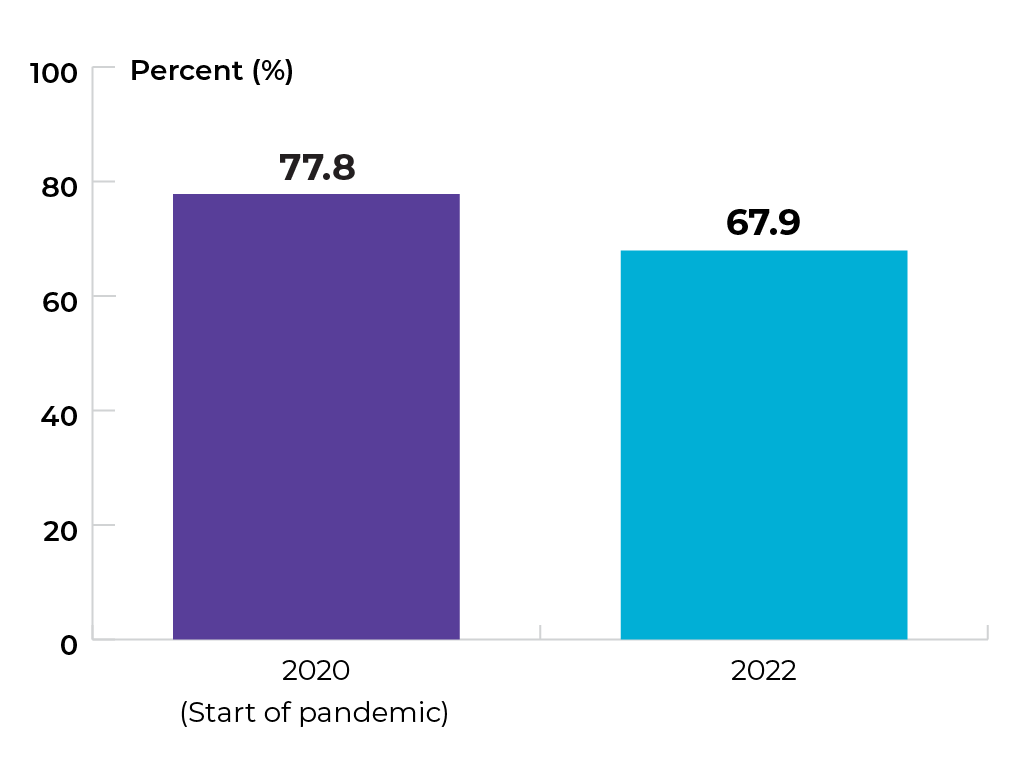
Data source: PEI Ambulatory Care Patient Satisfaction Survey
Topic: Improving availability of information and support
Title of image: Percentage of patients who feel staff told them about other services and supports available in the community, by location
Caveats/limitations: The COVID-19 pandemic may have affected service provision.
Data source: PEI Ambulatory Care Patient Satisfaction Survey
Priority 5 Action 2: Address the limited and unequal access to palliative and end-of-life care across Canada
Topic: Improving access to quality end-of-life care
Title of image: Cumulative length of stay for cancer patients (overall) who were in or admitted to an acute care hospital 30 days prior to death across PE, for fiscal years 2015, 2017, and 2019
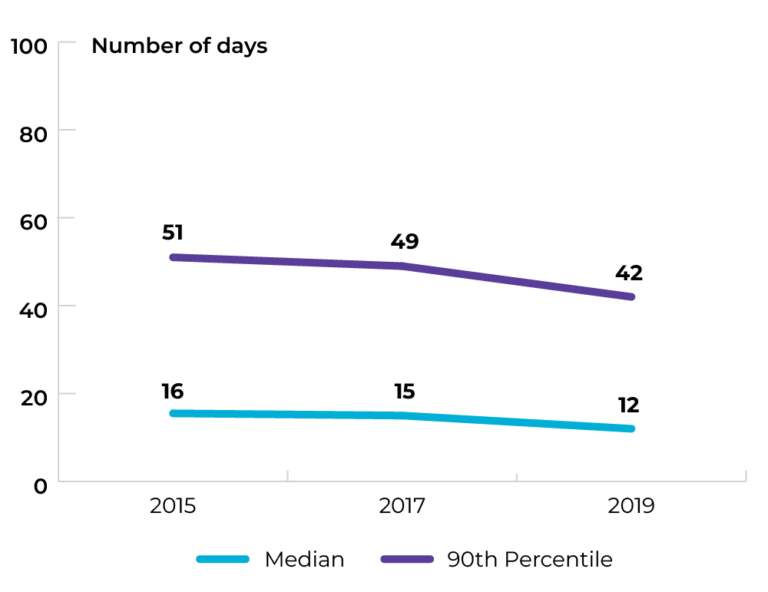 Data source: Canadian Institute for Health Information (CIHI), Discharge Abstract Database (DAD)
Topic: Improving access to quality end-of-life care
Title of image: Cumulative length of stay for cancer patients (rural/remote) who were in or admitted to an acute care hospital 30 days prior to death across PE, for fiscal years 2015, 2017, and 2019
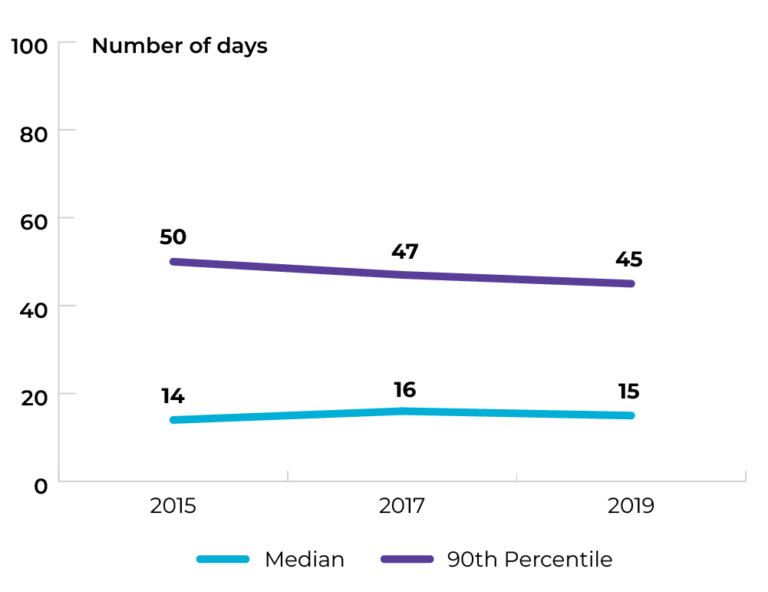
Data source: Canadian Institute for Health Information (CIHI), Discharge Abstract Database (DAD)
Topic: Improving access to quality end-of-life care
Title of image: Cumulative length of stay for cancer patients (urban) who were in or admitted to an acute care hospital 30 days prior to death across PE, for fiscal years 2015, 2017, and 2019
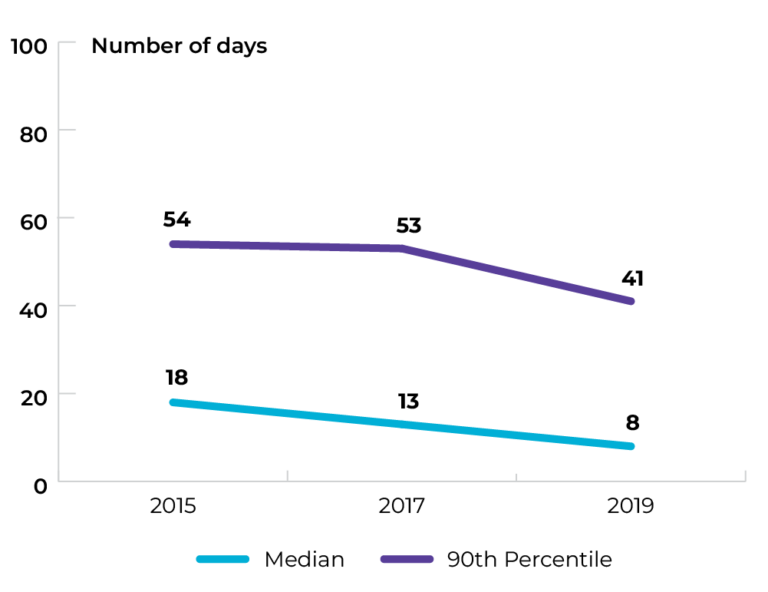
Data source: Canadian Institute for Health Information (CIHI), Discharge Abstract Database (DAD)
Topic: Improving access to culturally safe palliative care
Title of image: Percentage of patients identified for palliative care that have advanced care planning/goals for care discussions initiated
Caveats/limitations:
- This measurement includes all patients enrolled in the PEI Integrated Palliative Care Program (IPCP). Patients receiving palliative care treatment but not enrolled in IPCP are not included at this time.
- The COVID-19 pandemic may have affected service provision.
 Data source: Provincial cancer agencies and programs
The data tables and technical appendix for all indicators are available upon request at info@partnershipagainstcancer.ca. You will receive a response in two to three business days.